
A new study (Nilsson and Gardner, 2026) finds that from 1992 to 2023, mass loss from the Greenland ice sheet (GIS) and peripheral glaciers contributed just 1.1 cm (11 mm) to global sea level—about 0.37 mm per year. [some emphasis, links added]
Greenland’s ice mass losses have not followed a pattern that would suggest linearly rising CO2 emissions are driving ice melt.
In fact, from 1992 to 2001, the GIS and coastal glaciers contributed to a net reduction in global sea levels, with net ice-sheet mass gains amounting to +50 Gt/yr.
From 2002 to 2011, Greenland experienced a decade of rapid ice loss, amounting to -303 Gt/yr, spawning an era of alarmist “tipping point” headlines and IPCC doomsday reporting.
Since then, however, GIS loss has slowed about 60%, to -124 Gt/yr. This slowdown has been attributed to ocean cooling and a positive surface mass balance (SMB) over the last decade.
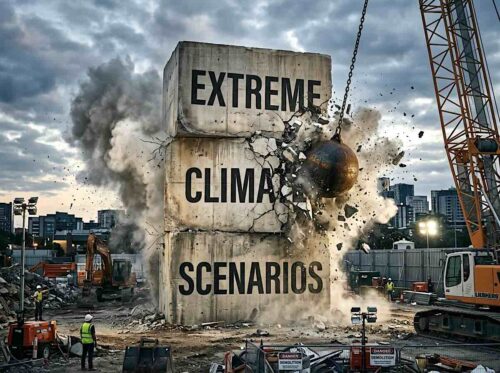
Despite the rapid 60% deceleration in ice melt, there are no signs of a slowdown in alarmist narratives about GIS ice loss.

Read more at No Tricks Zone


The claim that Greenland’s ice loss slowed by 60% over the last decade is a myth based on a misinterpretation of short-term weather fluctuations and specific data sets. While some years show lower melt than others due to natural variability, the long-term trend of rapid ice loss continues.
Satellite observations from NASA and other agencies confirm Greenland has lost ice every year since 1998. Since 2002, the ice sheet has lost over 5 trillion metric tons of ice.
The myth often stems from Danish Meteorological Institute (DMI) data on “surface mass balance” (SMB), which only measures snowfall versus surface melting. It excludes the massive amount of ice lost when glaciers break off (calve) into the ocean, which accounts for roughly half of Greenland’s total ice loss.
Accelerating, Not Slowing: Research indicates Greenland’s ice sheet is shedding ice seven times faster than it did in the 1990s. The average annual loss increased from 33 billion tons per year in the 1990s to approximately 254–264 billion tons annually in recent decades.
While some specific years (like 2024) saw lower-than-average loss due to temporary regional weather patterns like El Niño, experts emphasize these are short-term “noise” that do not reverse the “steeper and longer-lasting” downward trend.
Greenland’s ice mass losses not followed
a pattern that would suggest linearly rising
CO2 emissions are driving ice melt
Since the early 2000s,, the near-balance state ended,
and mass loss has accelerated significantly.
Richard’s comment is deceptive but it is not his fault. He based it on a Google post which is very deceptive. The trouble is the huge numbers such as a loss of 5 trillion metric tons of ice seem large but have no reference point. Since we are dealing with such large numbers I’ll use engineering notation where the number 10,000 is represented as 10 E3.
Greenland’s total ice is 2.7 E15 metric tons, and the loss since 2002 as 5 E9 metric tons. This is a loss of 0.000185%. If there is an annual loss of 264 E9 metric tons that equates to 0.00978%. Before there was the effort to make climate change an apocalyptic disaster if drastic action wasn’t taken by 2030, the movement used the target year of 2100. In the unlikely event that ice loss is accelerating as the activists claim, this would be loss of 0.72% by 2100.