 One to Two Meters Of Sea Level Rise By 2100 A ‘Highly Erroneous’ Claim
Geophysicist and tectonics expert Dr. Aftab Khan has unearthed a massive fault in the current understanding of (1) rapid sea level rise and its fundamental relation to (2) global-scale warming/polar ice melt.
Succinctly, Dr. Khan concludes the two have little to nothing to do with one another.
That’s because land height changes — subsidence (sinking) or uplift (rising) — connected to the Earth’s gravitational attraction and shifting plates assume the dominant role in determining sea level rise and fall.
The extent to which thermal expansion from rising ocean heat contributes to sea level rise is, as Dr. Khan indicates, “definitely a conjecture”.
Uplift And Subsidence Occurring Today
Along the coast of Juneau, Alaska, for example, the land surface has been rapidly rising due to gravitational uplift for many decades. Consequently, relative sea levels are plummeting in this region at a rate of over -13 mm/yr (-5 inches per decade) according to NOAA.

The opposite is occurring along the U.S. Gulf coast (Grand Isle, Louisiana), where the land area is sinking and thus sea levels are rising at a rate of over +9 mm/yr.

Sea Level Rise Trends Not Determinative Of Shoreline Changes
Many other scientists have also concluded that “sea level rise is not the primary factor controlling the shoreline changes” in regions where sea level rise is quite high. Even at rates exceeding 5 mm/yr, sea levels aren’t rising fast enough to overcome the much more pronounced changes in coastal expansion due to accretion and uplift.
“We show that Grande Glorieuse Island has increased in area by 7.5 ha between 1989 and 2003, predominantly as a result of shoreline accretion [growth]: accretion occurred over 47% of shoreline length, whereas 26% was stable and 28% was eroded. Topographic transects and field observations show that the accretion is due to sediment transfer from the reef outer slopes to the reef flat and then to the beach. This accretion occurred in a context of sea level rise: sea level has risen by about 6 cm in the last twenty years and the island height is probably stable or very slowly subsiding. This island expansion during a period of rising sea level demonstrates that sea level rise is not the primary factor controlling the shoreline changes. This paper highlights the key role of non-climate factors in changes in island area, especially sediment availability and transport.”
“The geological stability and existence of low-lying atoll nations are threatened by sea-level rise and climate change. Funafuti Atoll, in the tropical Pacific Ocean, has experienced some of the highest rates of sea-level rise (∼5.1 ± 0.7 mm/yr), totaling ∼0.30 ± 0.04 m over the past 60 yr. We analyzed six-time slices of shoreline position over the past 118 yr at 29 islands of Funafuti Atoll to determine their physical response to recent sea-level rise. Despite the magnitude of this rise, no islands have been lost, the majority have enlarged, and there has been a 7.3% increase in net island area over the past century (A.D. 1897–2013).”
This is not just a local phenomenon, either. Instead of shrinking coasts and submerged shorelines due to global sea level rise and polar ice melt, scientists have found that the land area above sea level has been growing across the world since the 1980s (Donchyts et al., 2016) . . . during the same period of time that anthropogenic CO2 emissions were rising.
“We expected that the coast would start to retreat due to sea level rise, but the most surprising thing is that the coasts are growing all over the world,” said Dr. Baart. “We were able to create more land than sea level rise was taking.”
Modern Sea Level Change Rates Almost Undetectable Relative To Past
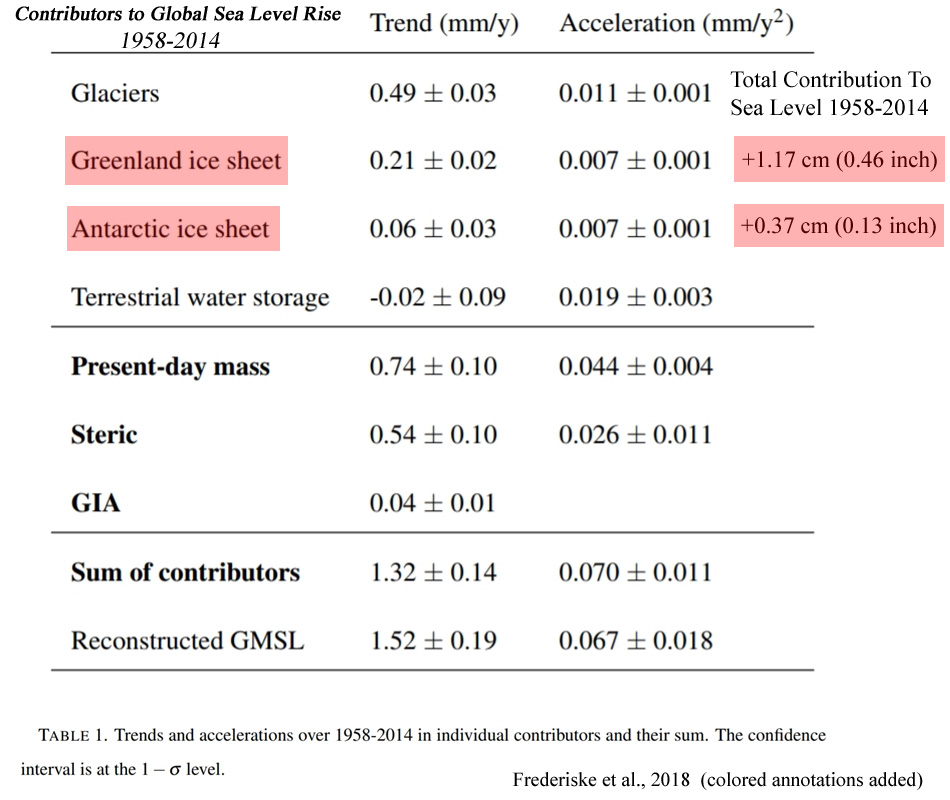
Since 1958, sea levels have only been rising at a rate of between 1.3 and 1.5 millimeters per year, a rate of about 5 to 6 inches per century (Frederiske et al.,2018).
Meltwater from the Greenland and Antarctica ice sheets combined has contributed just 0.59 of an inch to global sea levels during this period (Frederiske et al.,2018).
Between 16,500 years ago and 8,200 years ago, by comparison, the average rate of global sea level rise was 1.2 meters per century (12 mm/yr), which is more than 800% faster than the rate achieved since 1958. Included in that rate average is the “meltwater pulse” epoch around 14,500 years ago, when sea levels rose at rates of 4 meters per century (40 mm/yr).
“Rates and patterns of global sea level rise (SLR) following the last glacial maximum (LGM) are known from radiometric ages on coral reefs from Barbados, Tahiti, New Guinea, and the Indian Ocean, as well as sediment records from the Sunda Shelf and elsewhere. … Lambeck et al. (2014) estimate mean global rates during the main deglaciation phase of 16.5 to 8.2 kilo-annum (ka) [16,500 to 8,200 years ago] at 12 mm yr−1 [+1.2 meters per century] with more rapid SLR [sea level rise] rates (∼ 40 mm yr−1) [+4 meters per century] during meltwater pulse 1A ∼ 14.5–14.0 ka [14,500 to 14,000 years ago].”
Donoghue (2011) provides a visualization of the insignificance of modern changes relative to the past.
“For much of the period since the last glacial maximum (LGM), 20,000 years ago, the region has seen rates of sea level rise far in excess of those experienced during the period represented by long-term tide gauges. The regional tide gauge record reveals that sea level has been rising at about 2 mm/year for the past century, while the average rate of rise since the LGM has been 6 mm/year, with some periods of abrupt rise exceeding 40 mm/year [4 meters per century].”
“Sea level has at times risen at rates more than 20 times that of today, more than 40 mm/year. At such rates, the regional shorelines would have retreated by as much as 40 m/year, or more than 75 cm/week.”

Scientists affirm that an anthropogenic fingerprint in sea level rise trends is currently still “too small to be observable”.
“[B]y making use of 21 CMIP5 coupled climate models, we study the contribution of external forcing to the Pacific Ocean regional sea level variability over 1993–2013, and show that according to climate models, externally forced and thereby the anthropogenic sea level fingerprint on regional sea level trends in the tropical Pacific is still too small to be observable by satellite altimetry.”
“Furthermore, regressed CMIP5 MME-based sea level spatial trend pattern in the tropical Pacific over the altimetry period do not display any positive sea level trend values that are comparable to the altimetry-based sea level signal after having removed the contribution of the decadal natural climate mode. This suggests that the residual positive trend pattern observed in the western tropical Pacific is not externally forced and thereby not anthropogenic in origin.”
New Paper: Meter-Scale Sea Level Rise Only Related To Large-Scale Geologic Events
In a new paper published in the journal Geoscience Frontiers, Dr. Khan concludes that “both regional and local sea-level rise and fall in meter-scale is related to the geologic events only and not related to global warming and/or polar ice melt.”
Obviously, this leaves no room for global warming and polar ice melt to contribute to the alarming sea level rise predicted to materialize by the end of the century. Modeled predictions of 1 to 2 meters of sea level rise by 2100 are deemed “highly erroneous.”
Hence, suggestions of an anthropogenic influence on sea level change — the scariest aspect of climate modeling predictions — may be significantly undermined by scientific observation.
Why would sea-level rise for global warming and polar ice-melt?
Summary
•”Geophysical shape of the earth is the fundamental component of the global sea level distribution. Global warming and ice-melt, although a reality, would not contribute to sea-level rise. The gravitational attraction of the earth plays a dominant role in sea level rise.”
•”As a result of low gravity attraction in the region of the equatorial bulge and high gravity attraction in the region of polar flattening, melt-water would not move from polar region to equatorial region. Further, melt-water of the floating ice-sheets will reoccupy the same volume of the displaced water by floating ice-sheets causing no sea-level rise. The Arctic Ocean in the north is surrounded by the land mass thus can restrict the movement of the floating ice, while the Antarctic in the south is surrounded by open ocean thus floating ice can freely move to the north. Melting of a huge volume of floating sea-ice around Antarctica not only can reoccupy volume of the displaced water but also can cool ocean-water in the region of equatorial bulge thus can prevent thermal expansion of the ocean water.”
•”Melting of land ice in both the polar region can substantially reduce the load on the crust allowing the crust to rebound elastically for isostatic balancing through uplift causing sea level to drop relatively. Palaeo-sea level rise and fall in macro-scale are related to marine transgression and regression in addition to other geologic events like converging and diverging plate tectonics, orogenic uplift of the collision margin, basin subsidence of the extensional crust, volcanic activities in the oceanic region, prograding delta buildup, ocean floor height change and sub-marine mass avalanche.”
•”Claim and prediction of 3 mm/yr rise of sea-level due to global warming and polar ice-melt is definitely a conjecture.”
•”Prediction of 4–6.6 ft sea level rise in the next 91 years between 2009 and 2100 is highly erroneous.”
Thermal Expansion Claimed Or Opined To Be Dominant Contributor To Sea Level Rise
•”It is also claimed that ocean thermal expansion and glacier melting have been the dominant contributors to 20th-century global mean sea level rise. It is further opined that global warming is the main contributor to the rise in global sea level since the Industrial Revolution (Church and White, 2006).”
•”According to Cazenave and Llovel (2010) rising of air temperature can warm and expand ocean waters wherein thermal expansion was the main driver of global sea level rise for 75 to 100 years after the start of the Industrial Revolution. However, the share of thermal expansion in global sea level rise has declined in recent decades as the shrinking of land ice has accelerated (Lombard et al 2005). Lombard et al. (2006) opined that recent investigations based on new ocean temperature data sets indicate that thermal expansion only explains part (about 0.4 mm/yr) of the 1.8 mm/yr observed sea level rise of the past few decades. However, observation claim of 1.8 mm/yr sea level rise is also limited in scope and accuracy.”
Are Thermal Expansion–>Sea Level Change Models Accurate?
•”Lombard et al. (2006) opined that recent investigations based on new ocean temperature data sets indicate that thermal expansion only explains part (about 0.4 mm/yr) of the 1.8 mm/yr observed sea level rise of the past few decades. However, observation claim of 1.8 mm/yr sea level rise is also limited in scope and accuracy.”
•”According to Domingues et al. (2008), sea level rose about 0.8 mm/yr for the period 1993–2003. On the other hand, the climate threat investigation using a combination of atmosphere-ocean modeling, information from paleoclimate data, and observations of ongoing climate change revealed that modeling is an imperfect representation of the climate system, paleo-data consist mainly of proxy climate information usually with substantial ambiguities, and modern observations are limited in scope and accuracy (Hansen et al., 2016).”
•”According to Zhang (2007) thermal expansion in the lower latitude is unlikely because of the reduced salt rejection and upper-ocean density and the enhanced thermohaline stratification tend to suppress convective overturning, leading to a decrease in the upward ocean heat transport and the ocean heat flux available to melt sea ice. The ice melting from ocean heat flux decreases faster than the ice growth does in the weakly stratified Southern Ocean, leading to an increase in the net ice production and hence an increase in ice mass.”
Sea Level Changes Linked To Large-Scale Geological Events
•”There are a good number of publications about the post-glacial isostatic rebound of the polar region. Works of Fleming et al. (1998) and Milne et al. (2005) are based on the vertical geologic motions associated with the post-glacial continental and isostatic rebound. Johansson et al. (2002) conducted research on a project BIFROST (Baseline Inferences for Fennoscandian Rebound Observations, Sea-level, and Tectonics) that combines networks of continuously operating GPS receivers in Sweden and Finland to measure ongoing crustal deformation due to glacial isostatic adjustment (GIA). They have found the maximum observed uplift rate 10 mm/yr for Fennoscandian region analyzing data between August 1993 and May 2000. Sella et al. (2007) and Lidberg et al. (2010) suggested that postglacial rebound continues today albeit very slowly wherein the land beneath the former ice sheets around Hudson Bay and central Scandinavia, is still rising by over a centimeter a year, while those regions which had bulged upwards around the ice sheet are subsiding such as the Baltic states and much of the eastern seaboard of North America.”
•”Snay et al. (2016) have found large residual vertical velocities [land uplift], some with values exceeding 30 mm/yr, in southeastern Alaska. The uplift occurring here is due to present-day melting of glaciers and ice fields formed during the Little Ice Age glacial advance that occurred between 1550 A.D. and 1850 A.D.”
•”Alaska is undergoing crustal deformation of uplift and subsidence each year within elastic-plastic phase associated with ice melt and ice cover formation. When ice melts, load from the crust is reduced and it is uplifted and when ice cover builds-up, load onto the crust is increased and it is subsided. Hence, the pattern of the sea level curve of Alaska is oscillatory. Secondly, for each uplift and subsidence there remains a residual value between uplift and subsidence which is positive, hence, the corresponding sea level curve is negative.”
•”When the land area shrinks globally, this corresponds to a global rise in sea level. From the curve, it is certain that sea level has changed in geologic time scale due to geologic events.”
•”Because global cycles of sea level changes are the records of geotectonic, glacial, and other large-scale processes, they reflect major events of Phanerozoic (Mesozoic to Present) history. These events are related mostly to the large-scale orogenic (mountain building) movement such as trans-Himalayan orogeny, sedimentary basins formation such as Bengal Basin and Gulf Coast Basins. The Phanerozoic history of North America from the Late Triassic or Early Jurassic, corresponds to the Pangea breakup phase, during which North America drifted westwards. The eastern continental margin became the modern extensional Atlantic margin basins, while the western margin underwent tectonism and accretionary prism formation leading to the assembly of the Cordilleran orogen. Similar extensional basins and sedimentary accretionary prism leading to orogens developed along the eastern margin of the Atlantic Ocean in Africa and Europe, and in some region of Asia. These mega-events of the earth led to major sea-level rise and fall in terms of hundreds of meters as oceans suffered regional transgressions and regressions. Hence, when a region undergoes major subsidence can cause relative sea level (RSL) rise to the tune of tens of meters. Examples of mid-Holocene (about 8000 years ago) subsidence forming Gange’s depression, Jamuna depression and Meghna depression in the Bengal Basin causing major marine transgression to signify sea level rise in terms of 10 s of meters (Khan et al., 2000).”
Visual Evidence Of Uplift/Subsidence Determining Sea Level Rise/Fall
•”Geological processes are responsible for two types of major movements of the crustal block viz., uplift and subsidence. Hence, the relation of sea level and crustal motion is attributed to sea level drops when there is an uplift while it rises when there is subsidence.”
•”Examples of uplift and subsidence of the crustal segments are given in the Fig. 13A–H. The layered beach at Bathurst Inlet, Nunavut, is an example of post-glacial rebound after the last Ice Age. Isostatic rebound is still underway here (Fig. 13A). Some of the most dramatic uplifts are found in Iceland. Much of modern Finland is former seabed or archipelago that shows sea level immediately after the last ice age (Fig. 13B). Massive coral (Pavona clavus) exposed in 1954 by tectonic uplift in the Galapagos Islands, Ecuador (Fig. 13C). Beach ridges on the coast of Novaya Zemlya in arctic Russia. Such ridges are formed by pushing of sea ice as a result of Holocene glacio-isostatic rebound (Fig. 13D). A beach in Juneau, Alaska, where sea level is not rising, but dropping precipitously due to a phenomenon known as glacial isostatic adjustment GIA (Fig. 13E). Boat-houses in Scandinavia now considerably farther away from the water’s edge where they were built demonstrates land uplift (Fig. 13F). An 8000-year old-well off the coast of Israel now submerged is a landmark of crustal subsidence (Fig. 13G). The “City Beneath the Sea”; Port Alexandria on the Nile delta fits with the drowned well off the coast of Israel (Fig. 13G), both subsided due to subduction-pull of the downgoing African crustal slab as it enters the Hellenic trench (Fig. 13H). Venice is vanishing because of tectonics (subduction rollback of the Adriatic slab) wherein down-going crustal segment causing subsidence of Venice, rather than sea level rise associated with global warming and/or polar ice melt.”

Meter-Scale Sea Level Changes Only Related To Geologic Events, Not Global Warming
•”Transgression commences when continental block undergoes subsidence with respect to the continental shelf and abyssal plain, while regression occurs when this process is reverse i.e. when the continental block is uplifted with respect to the continental shelf and abyssal plain. Prograding delta system in low lying areas and other geologic events may cause local/relative sea-level fall as new sedimentary deposition advances as accretion pushing sea further down the coast irrespective of global warming and polar ice melt.”
•”Hence, both regional and local sea-level rise and fall in meter-scale is related to the geologic events only and not related to global warming and/or polar ice melt.”
•”Information on the relative sea-level rise over the last ∼8,000 years obtained from a variety of geological indicators exhibit vertical land movement at tide-gauges resulting from glacial isostatic adjustment (GIA) theory. Although if it is generally thought that paleo sea level change of 10s to 100s m or future prediction of sea level rise more than 1m in 100 years are due to the continuous process of the Earth, it is rather an abrupt or sudden geological process of fault rupture to result in crustal uplift and subsidence causing a visible sea level change. So a visible measure of the sea level change is possible only after sudden fault rupture displacement between continent and ocean/sea. Although a continuous deformation process prior to the uplift and subsidence could progress, a visible deformation of the crust would occur only due to sudden rupture (fault) of the crust.”
•”In conclusion, global warming, both polar and terrestrial ice melts, and climate change might be a reality but all these phenomena are not related to sea level rise and fall.”
Read more at No Tricks Zone


”When the land area shrinks globally, this corresponds to a global rise in sea level. From the curve, it is certain that sea level has changed in geologic time scale due to geologic events.”
Sorry.
Meant to insert this Video https://www.youtube.com/watch?v=4GUcn07enz4
Many changes are governed by complex natural factors as this excellent article shows. However, if an alarmist’s political goal has little hope of success except through the climate change agenda, they put a negative spin on the change and blame man’s emissions.