
“The reality is that as climate change continues, the pattern of more heat waves, more droughts, more heavy weather, and of course also more floods is going up. And with this type of event, you know, continuing ever more frequently, you will see more damage… the ever-larger economic damage that climate change, unfortunately, is bringing to our societies.” — Wopke Hoekstra, European Commissioner for Climate, Net Zero and Clean Growth, July 1, 2026
A disaster loss normalization estimates what direct economic losses related to an extreme event of the past would occur if that same event happened under today’s economic conditions — today’s infrastructure, property, and wealth. [some emphasis, links added] [some emphasis, links added]
Today, I present a new normalization of Europe’s weather and climate catastrophe losses for 1990 to 2024, updating an analysis I first shared here at THB three years ago, covering 1995 to 2019.
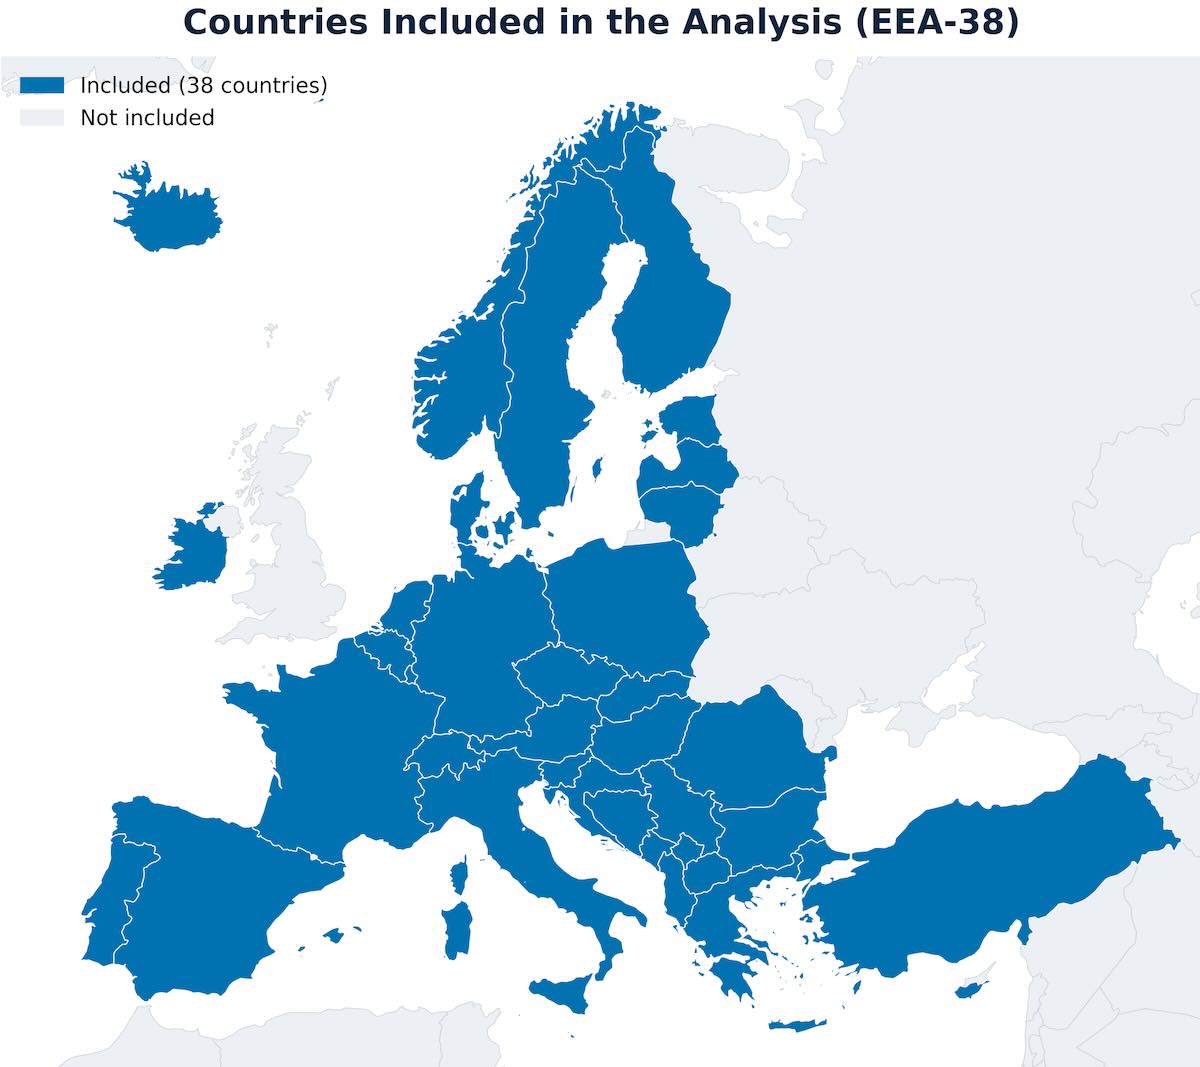
The European Environment Agency (EEA) has since updated and reorganized its underlying catastrophe loss dataset. That extends the time series by ten years, includes the catastrophic floods in Germany and Belgium in 2021, and provides a broader country grouping (the full EEA-38, which adds the Western Balkans).1
Countries included in the analysis are shown below:
Here is the top-line conclusion:
Once you account for economic growth, the normalized cost of weather and climate extremes in Europe has not increased over 1990–2024. The overall trend is flat.
This post shares the data, methods, and significance of the analysis. At the bottom of the post is a methods appendix, a bibliography, and, for THB paid subscribers, an Excel spreadsheet with all sources, data, and calculations.2
Inflation-Adjusted Losses Are Increasing
Economic losses from weather- and climate-related events across the 38 EEA countries over 1990–2024 (in inflation-adjusted 2024 Euros) have increased, as shown in the figure below.

The time series shows a sharp increase over more than three decades. Taken at face value, a casual observer would conclude European disasters are becoming dramatically more expensive, with a growing impact on the continent’s economy.
That conclusion — as expressed in the quote at the top of this post — would be wrong.
Normalization: Accounting For Economic Growth
Over these 35 years, the combined economy of the 38 countries more than doubled in real, inflation-adjusted terms — accompanied by an increase in buildings, infrastructure, and wealth, and therefore far more stuff exposed to storms or floods.
All else equal, the euro cost of a fixed set of physical events must increase simply because more wealth is exposed to extreme events.
A normalization corrects for changes in exposure and vulnerability. The simplest version scales each year’s loss by the ratio of a base year’s economic output (GDP, in this case 2024) to the corresponding year’s output:
Normalized loss in year t = Reported loss in year t × ( GDP in 2024 ÷ GDP in year t )
The literature contains far more sophisticated methodological approaches to normalization. However, the United Nations Sendai Framework on Disaster Risk Reduction has adopted losses as a percent of GDP as an official indicator of progress in disaster risk reduction.
The figure below shows a GDP-based normalization of the time series above, adjusted to a constant 2024 level — the dramatic upward trend disappears.

The early 1990s — modest in raw terms — became some of the most damaging years on record once exposure is held constant. The 1999 windstorms Lothar and Martin, the 2002 central-European floods, and the 1990 storm season rival or exceed the recent large-loss years.
At ~0.25% of GDP, 2021 was the most economically significant year of losses since 2002. However, normalized losses in 1990 and 1999 were even greater.
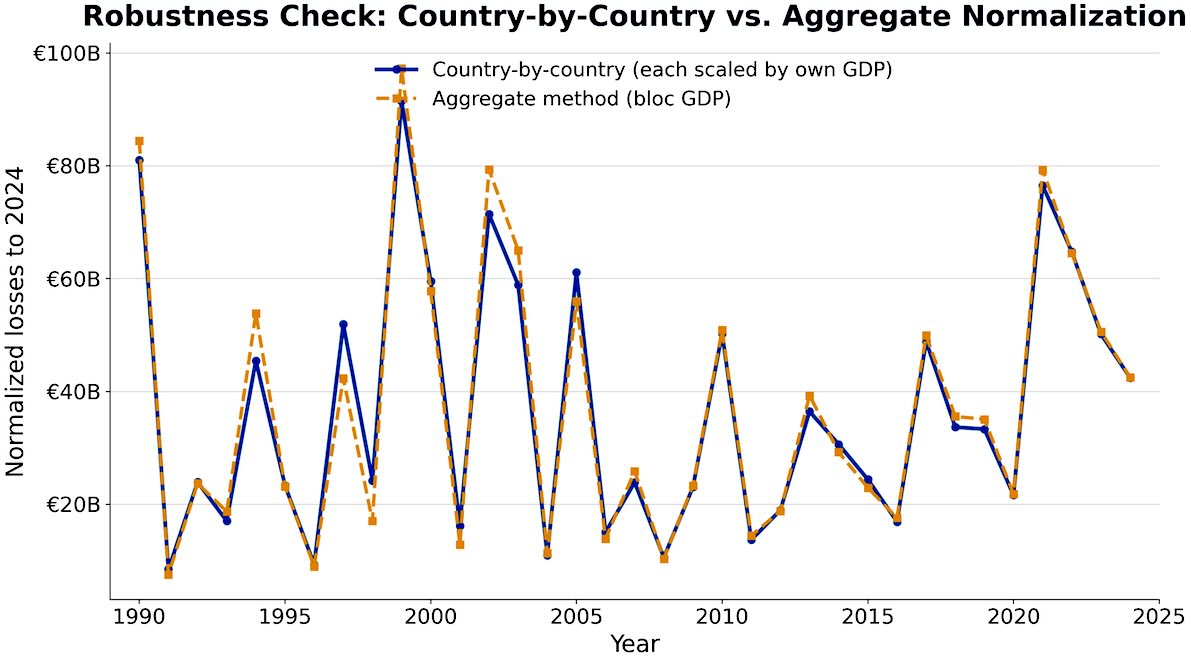
A Robustness Check: Does The Method Matter?
Above, I normalized the aggregate continental losses based on aggregate GDP — scaling Europe’s total losses by Europe’s total GDP growth. But these countries did not grow at the same rate.
Poland, Romania, and the Baltics expanded several times faster than Germany or France over this period. If a disproportionate share of early losses fell in fast-growing economies, normalizing the bloc as a whole could distort the picture.
As a robustness check, I also normalize losses reported for each country by its own GDP growth and then sum the results. A comparison of the two methods is shown below, and there is very little difference between them.
The Honest Broker is written by climate expert Roger Pielke Jr and is reader-supported. If you value what you have read here, please consider subscribing and supporting the work that goes into it.
Read rest at The Honest Broker


They will manipulate the facts to fit the shoes.
Who would believe the flat curves? There is not even a relation visible to the disaster of “Covid”.
Farmers are being ruined. Less cattle, less farts. less CO2, less farmers.
The cost of those wind turbines is insane 300 billion in NL and they are inefficient according to a real professor.
Another professor, who opposed this statement, however had to admit that the prior professor was right in his calculations about impact of the green insanity and the inefficient EV’s, or the cost of minerals and overall costs and power compared to “fossil fuel”, or other much cheaper conventional ways to generate power. Science produces what they are being paid for. Nobody even mentions the influence of the Sun and other astronomic events or cycles. But the rich make tons of money with the exchange of Carbon footprints. Carbon Zero is just the most dangerous goal ever.