• Privacy Policy
  • About Us
  • Contact Us
Climate Change Dispatch
  • Home
  • Videos
  • Who We Are
  • Facts Vs. Fearmongering
    • Real science vs Junk Science
      • 1100-plus Peer-Reviewed Studies
      • Michael Crichton: Aliens Cause Global Warming
      • Climate change and its causes
      • Climate Science Primer
      • CO2 is not pollution
      • Deceptive Surface Temperature Records
      • Editorial: Great Global Warming Hoax
      • Rules for Climate Radicals: Part 1
      • Rules for Climate Radicals: Part 2
      • Rules for Climate Radicals: Part 3
      • Why CO2 Is A Minor Player In Global Climate
      • Why Politicized Science Is So Dangerous
    • Facts Not Fear
      • A Simple Question For Climate Alarmists
      • Climate Change – The Facts
      • Climate Change Fears Are Empirically Baseless
      • Global Warming 101
      • Global Warming Q&A
      • Understanding The Medieval Warm Period
      • Ocean Cycles and Climate
      • Overview of Plate Climatology Theory
      • Precautionary Principle
      • Should We Celebrate Carbon Dioxide?
      • The Skeptics Handbook
      • Weather Versus Climate
      • Why I’m a GW skeptic
      • Winning the climate debate with facts
      • Why Aliens Cause Global Warming
    • Greenhouse FAQs
      • CO2, Plants, & Industry
      • How much have temps changed?
      • How much have temps changed?
      • How much have temps changed?
      • Is global warming real?
      • Measuring temperature
      • Swimming in CO2?
      • Scientists urge caution?
      • Today’s warming trend
      • Variations in temperature
    • Gore’s Greatest Goofs
      • Deconstructing the Truth
      • Fact-Checking Al Gore’s Latest Predictions
      • How Gore Created The Global Warming Hoax
    • Inside Real Climate
      • Closer look at the 97% Consensus
      • GW’s Amazing Story
      • IPCC gets failing grade
      • Real Climate Exposed!
      • Truth about Real Climate
      • We’ve Been Conned
      • What is there a 97% consensus about?
    • Behind the IPCC
      • 1,000 Scientists Dissent
      • Climategate: Caught Green-Handed!
      • Climategate Inquiries
      • Climategate Inquiries 2
      • NIPCC Report Now Available
      • Understanding the Climategate Inquiries
  • Submissions
  • Contact Us
No Result
View All Result
Climate Change Dispatch
No Result
View All Result

New Study: All Computer Models Have Underestimated Volcanism’s Effect On Climate

by James Edward Kamis, guest post
June 28, 2023, 2:18 PM
in News and Opinion
Reading Time: 6 mins read
A A
4

tonga-hunga volcanoIn a stunning turn of events, a study by the University of Cambridge released on June 13, 2023, has concluded that all current climate models need to be significantly updated because they do not include the effects that volcanic activity has on climate.

The researchers state that the effect that volcanism has on our climate is four times greater than previously estimated.

The conclusions of this study are confirmation that the building principles of the Plate Climatology Theory, which was released to the public on October 7, 2014, are correct.

Figure 1: Volcanic eruption sends ash into the atmosphere (Image credit CBS News and NASA).

The conclusion of the Cambridge study stated:

“Climate projections are the simulations of Earth’s climate in the future using complex climate models. Standard climate projections, as in Intergovernmental Panel on Climate Change Sixth Assessment Report, assume that explosive volcanic activity over 2015–2100 is of the same level as the 1850–2014 period. Using the latest ice-core and satellite records, we find that explosive eruptions could emit more sulfur dioxide into the upper atmosphere for the period of 2015–2100 than standard climate projections. Our climate model simulations show that the impacts of volcanic eruptions on climate, including global surface temperature, sea level, and sea ice extent, are underestimated because current climate projections do not fully account for the recurrent frequency of volcanic eruptions. We also find that small-magnitude eruptions occur frequently and can contribute a significant effect on future climate”. (See Here).

If the effect of volcanic activity has significantly altered Earth’s climate as per the Cambridge study, then why have all previous researchers failed to recognize the effect of this activity? Three reasons may have played a role in their failure. They are Remoteness, Interpretation Bias, and Lack of Monitoring.

Remoteness

Figure 2: The elevation map of the Pacific Ocean covers 64,000,000 square miles and has an average depth of 14,000 feet. (Image credit Google Earth and some labeling by J. Kamis)

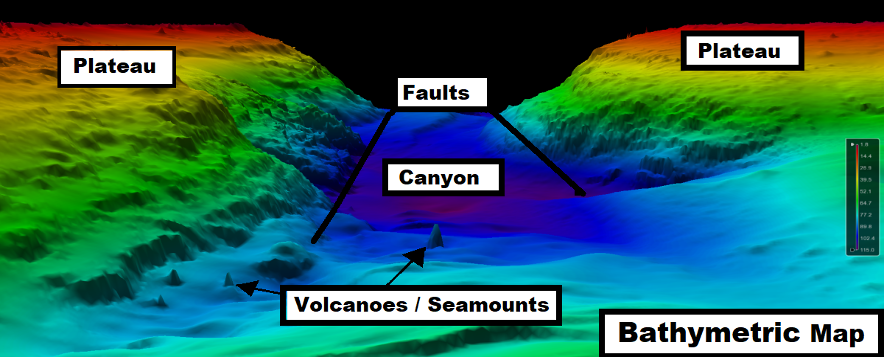
Oceans cover 71% of the Earth’s surface and have an average depth of 14,000 feet (Figure 2). Polar ice sheets cover 9% and have an average thickness of 6,200 feet. Sea Ice covers 5% of the earth’s surface. So, 85% of our planet is remote.

In the past, the bathymetry (elevation) of earth’s ocean floors has been mapped utilizing sound waves, satellites, and plum line type methods. However, most of this mapping is of low to moderate resolution. Ocean elevation is used to identify fault ridges, volcanoes, and hydrothermal vents. It has been difficult to recognize and count the number of these types of ocean floor geological features using low-resolution ocean floor elevation maps, making many of these features nearly invisible.

In 2017 the Nippon Foundation began its GEBCO Seabed Project whose goal is to accurately map 100% of Earth’s oceans. The excerpt below describes the goals and progress of this project. Via the BBC:

We’ve just become a little less ignorant about Planet Earth.

The initiative that seeks to galvanize the creation of a full map of the ocean floor says one-fifth of this task has now been completed.

When the Nippon Foundation-GEBCO Seabed 2030 Project was launched in 2017, only 6% of the global ocean bottom had been surveyed to what might be called modern standards.

That number now stands at 19%, up from 15% in just the last year.

Some 14.5 million sq km of new bathymetric (depth) data was included in the GEBCO grid in 2019 – an area equivalent to almost twice that of Australia.

It does, however, still leave a great swathe of the planet in need of mapping to an acceptable degree.

An example of a high-resolution ocean floor elevation map generated by the Foundation mapping project is shown in Figure 3.

Figure 3: A high-resolution three-dimensional image of an ocean floor area located off the east coast of Antarctica (Credit NOAA and labeling and drawings by J. Kamis).

Two research studies illustrate how higher-resolution ocean floor elevation mapping lets us see the correct number of geological features. These studies were conducted in the exact area located off the coast of California. The first study was older.

This older research study discovered an estimated 47 hydrothermal vents mostly located in five vent field complexes. The more recent study which utilized higher-resolution bathymetric data was able to identify a total of 572 hydrothermal vents (quote below).

The scientists gave these vent fields fanciful names such as Mothra, Salty Dawg, and Sasquatch. They also discovered that this region not only had a vast number of hydrothermal vents but that some of them were the tallest hydrothermal vents in the world. The tallest of these chimneys, “Godzilla,” reached a height of 45 meters (150 feet) before it toppled over in 1995.

This height reflects the magnitude of present-day or past emissions of super-heated and chemically charged emissions. Taller and larger vents can be interpreted to emit greater volumes of fluid or indicate that the vent emissions lasted longer. I believe this example shows that the effect of all ocean floor emissions from geological features, which eventually rise into the atmosphere, are not properly accounted for in climate computer models.

Interpretation Bias
Scientists have for many years force-fit climate trends and climate-related events into an atmospheric context insisting that the root cause of these trends and events is related to atmospheric forces.

This force-fit process does not follow proper scientific methodology because it ignores the climate influence of many other natural forces, most importantly geological forces.  Force fitting all data, observations, and trends into an atmospheric context is here termed “Interpretation Bias”. (Kamis 8-31-2015).

The Theory of Continental Drift was introduced by Alfred Wegener in 1912.  Wegener proposed that continents moved laterally across the earth’s surface, that their shapes fit together like a jigsaw puzzle, and that recent research studies showed that the limited distribution of specific fossils species existed on now far-apart continents.

He believed that this information proved continents drifted apart. The introduction of his theory was strongly rejected by all scientists, especially geologists, was not supported by peer-reviewed studies, did not fit the 100% proven theory that continents bobbed up and down termed Isostacy, and was extremely criticized by the press who then censored his theory.

It was not until the 1950 to 1977 period that scientists realized and then relented that Wegener’s theory was correct. Researchers collected data that confirmed that geological forces associated with large geological features, such as divergent fault systems, were part of the process that moved continents and large segments of ocean floor rock layers apart.

Since then, geologists and geophysicists have discovered that Upper Mantle Convection cells are the primary source of energy that acts to move continents and large ocean segments laterally or underneath each other at a rate of up to 1-2 inches per year.  Scientists used these refinements of Wegener’s theory to justify the renaming of the Continental Drift Theory to the Plate Tectonics Theory.

Insufficient Monitoring
The primary reason geological forces have remained hidden is Insufficient Monitoring. To properly calculate the effect geological forces, have on our oceans, atmosphere, and climate it will be necessary to increase the number of monitoring devices that measure emissions from ocean floor and land geological features. Proper monitoring requires that the devices need to record three aspects of geological emissions.

Frequency
Geologists have known for many years that geological features such as fault segments, volcanoes, hydrothermal vent complexes, etc. turn on and off in irregular patterns. To improve the understanding of these on-and-off patterns, it is imperative to integrate historical and modern data.

The proper integration of these two datasets needs to take into consideration that they differ in many ways, for instance, accuracy, the timespan between each data point, and the amount of data within each set. There needs to be additional monitoring of the current pattern of all geological features.

Duration
The time that each geological feature emits fluids (gas and viscous) before turning off is an important factor in determining the total volume emitted. The duration of emissions greatly varies from feature to feature.

It is common for geological features such as volcanoes to stay active for thousands of years and then suddenly shut down. Conversely, some geological features deemed extinct suddenly become active without warning.

I recognize that it is extremely difficult to establish the exact duration time of all types of geological features. However, additional data obtained by increased monitoring will help improve estimates of duration.

Volume
Scientists have proven that emissions from major terrestrial or oceanic volcanic eruptions have immediate and long-lasting effects on our climate. However, until recently scientists assumed that emissions from minor terrestrial or oceanic volcanic eruptions had very little or no effect on our climate.

This assumption has been proven to be incorrect. The Cambridge Study concluded that the cumulative amount of emissions from small and medium size terrestrial and oceanic volcanic eruptions have a significant effect on climate.

Summary
The conclusions of the Cambridge research study will require the updating of all current climate models because they don’t include the significant and underestimated effect volcanism has on climate.

More importantly, the Cambridge study proves that geological activity, either locally or globally, acts to release heated and chemically charged fluids from various types of geological features into Earth’s atmosphere. These emissions have in the past and still to this day acted to influence and, in many cases, completely control climate and climate-related events as per the Plate Climatology Theory.


James Edward Kamis is a retired Geologist with forty-two years of experience. He has a Bachelor of Science degree in Geology from Northern Illinois University and a Master of Science degree in Geology from Idaho State University. More than forty-six years of research have convinced him that geological forces significantly influence, or in some cases, completely control climate, and climate-related events as per his Plate Climatology Theory and latest book.

  • Truth
  • Twitter
  • Facebook
  • LinkedIn
  • Gettr
  • Threads
  • gab-logo Gab
  • Mastodon
  • Buffer
  • Telegram
  • Email
  • Copy Link
  • Share Using More Networks…

Popular Posts

Bipolar

New Study: Ice Core Data Shows Modern Warming Is Statistically Unremarkable

Mar 05, 2026
Energy

Climate Science’s Biggest Shift In Decades: IPCC’s RCP8.5 Is Officially Dead

Apr 29, 2026
Electric Vehicles (EVs)

The ‘Green’ Scam Of The Century: How ‘Renewables’ Increase Fossil Fuel Demands

Oct 23, 2024

Comments 4

  1. Pardon Arden says:
    3 years ago

    This also from the same U of Cambridge study: “Compared with the greenhouse gases emitted by human activity, the effect that volcanoes have on the global climate is relatively minor”

    Reply
    • David Lewis says:
      3 years ago

      It is estimated by geophysicists that only three volcanic eruptions, Indonesia (1883), Alaska (1912) and Iceland (1947), spewed more carbon dioxide into the atmosphere than all of human activities in our entire history.

      Reply
  2. Dave of Gold Coast, Aust. says:
    3 years ago

    Finally some reality. I have long held the view that vulcanism is mostly passed over and to be of little effect. Ignoring the obvious is foolhardy when history tells us of years without summers, leading to famine and death. We know something of Mt Tambora, Mt Krakatoa and even Mt Pinatubo. We know the historic devastation and the aftermath of Mt Vesuvius, and Santorani, the amount of ejecta and gasses must be huge.. Every day there are major eruptions taking place, yet up till now they are pretty much ignored. I suspect they may be far more, influential than even this article says.

    Reply
  3. David Lewis says:
    3 years ago

    For a long time I thought that volcanic activity doesn’t have much impact on the climate change debate. Significant carbon dioxide is being released from volcanoes and vents but this has been true for a long time. It turns out that the Antarctic Peninsula with its 500 volcanoes has become more active during the past 50 years. This timing is perfect for adding to the admissions being blamed on man. We have no way of knowing if this peninsula is adding very little or a significant percentage of the admissions of the past 50 years.

    Reply

Comments are welcome! Those that add no discussion value may be removed.Cancel reply

Stay Connected!

gab-logo

Donate Today

Beating back the alarmist narrative takes time and money. Please donate today to help!

Get notified when new posts are published!

Subscribe to receive a digest of daily stories, or get emailed once they're published. Check your Junk/Spam folder for a verification email.

Recent Posts

  • farmer tractor georgiaNo, Climate Change Isn’t Causing Georgia’s Extreme Weather—History Proves It
    Jul 3, 2026
    PBS pushed climate alarm over Georgia's drought and floods. A century of NOAA data tells a very different story. […]
  • cartoon eurocrat energy ogreEurope’s Heat Wave Isn’t The Crisis — Energy Poverty Is
    Jul 3, 2026
    A June heat wave sparked climate blame, but Lancet data shows cold kills 9x more people — the real crisis is energy poverty. […]
  • gas stove ny condoFederal Appeals Court Green-Lights New York’s Ban On New Gas Hookups
    Jul 3, 2026
    A federal appeals court rejected an industry lawsuit against New York's ban on natural gas hookups in new buildings, clearing the way for enforcement. […]
  • gov mikie sherrillNJ Punts On $50 Billion Climate Superfund Bill As Even Democrats Balk
    Jul 2, 2026
    New Jersey's climate superfund bill collapsed after Democratic defections and union pushback, leaving its $50 billion tax push in doubt. […]
  • cartoon hospital no air conditioningThanks To Climate Panic And No AC, Germany’s Top Hospital Hits 100 Degrees
    Jul 2, 2026
    A Düsseldorf hospital hit 100 degrees with heart surgery patients inside — because Germany's climate policy says AC isn't worth the energy. […]
  • eu storm coastal cityThe Myth Of Rising Climate Costs: Europe’s Weather Losses Are Flat Once Adjusted For Growth
    Jul 2, 2026
    New EEA data show Europe's normalized climate disaster losses have remained flat since 1990, once adjusted for economic growth. […]
  • climate etc officeClimatologist Judith Curry Declares Climate Alarmism Dead, Retires Landmark Blog
    Jul 1, 2026
    Climatologist Judith Curry is shuttering her influential blog, declaring the era of climate alarmism over after years disputing the mainstream narrative. […]
  • Asphalt Is Baking You Alive: The Real Story Behind Urban Heat Island Temperatures
    Jul 1, 2026
    Recent heat waves are strongly influenced by the widespread urban heat island effect, causing significant variations in surface temperatures based on its properties. […]
  • Trump Just Got the World Bank To Drop Its Climate Spending Goals
    Jul 1, 2026
    The World Bank dropped its 45% climate financing target after months of pressure from the Trump administration, the bank's largest shareholder. […]
  • french beach mediterraneanWhile Paris Official Trolled American AC, 48 People Drowned Trying To Cool Off In France
    Jul 1, 2026
    A Paris politician mocked Americans over air conditioning use — while 48 people drowned trying to cool off during France's own deadly heatwave. […]

Books You May Like

Cold Facts About the Great Global Warming Scam

Climate prn book

Sunset on Net Zero

Canary in a Climate World

Have a suggestion? Let us know! We swap out books based on your input. We participate in the Amazon Services LLC Associates Program. See here.

  • Privacy Policy
  • DMCA Policy
  • About Us
  • Contact Us

© Portions copyright Climate Change Dispatch

No Result
View All Result
  • Home
  • Videos
  • Who We Are
  • Facts Vs. Fearmongering
    • Real science vs Junk Science
      • 1100-plus Peer-Reviewed Studies
      • Michael Crichton: Aliens Cause Global Warming
      • Climate change and its causes
      • Climate Science Primer
      • CO2 is not pollution
      • Deceptive Surface Temperature Records
      • Editorial: Great Global Warming Hoax
      • Rules for Climate Radicals: Part 1
      • Rules for Climate Radicals: Part 2
      • Rules for Climate Radicals: Part 3
      • Why CO2 Is A Minor Player In Global Climate
      • Why Politicized Science Is So Dangerous
    • Facts Not Fear
      • A Simple Question For Climate Alarmists
      • Climate Change – The Facts
      • Climate Change Fears Are Empirically Baseless
      • Global Warming 101
      • Global Warming Q&A
      • Understanding The Medieval Warm Period
      • Ocean Cycles and Climate
      • Overview of Plate Climatology Theory
      • Precautionary Principle
      • Should We Celebrate Carbon Dioxide?
      • The Skeptics Handbook
      • Weather Versus Climate
      • Why I’m a GW skeptic
      • Winning the climate debate with facts
      • Why Aliens Cause Global Warming
    • Greenhouse FAQs
      • CO2, Plants, & Industry
      • How much have temps changed?
      • How much have temps changed?
      • How much have temps changed?
      • Is global warming real?
      • Measuring temperature
      • Swimming in CO2?
      • Scientists urge caution?
      • Today’s warming trend
      • Variations in temperature
    • Gore’s Greatest Goofs
      • Deconstructing the Truth
      • Fact-Checking Al Gore’s Latest Predictions
      • How Gore Created The Global Warming Hoax
    • Inside Real Climate
      • Closer look at the 97% Consensus
      • GW’s Amazing Story
      • IPCC gets failing grade
      • Real Climate Exposed!
      • Truth about Real Climate
      • We’ve Been Conned
      • What is there a 97% consensus about?
    • Behind the IPCC
      • 1,000 Scientists Dissent
      • Climategate: Caught Green-Handed!
      • Climategate Inquiries
      • Climategate Inquiries 2
      • NIPCC Report Now Available
      • Understanding the Climategate Inquiries
  • Submissions
  • Contact Us

© 2026 Climate Change Dispatch

 
Share via
  • Facebook
  • Twitter
  • Pinterest
  • LinkedIn
  • Digg
  • Tumblr
  • VKontakte
  • Print
  • Email
  • Reddit
  • Buffer
  • Love This
  • Weibo
  • Pocket
  • Xing
  • Odnoklassniki
  • WhatsApp
  • Meneame
  • Blogger
  • Amazon
  • Yahoo Mail
  • Gmail
  • AOL
  • Newsvine
  • HackerNews
  • Evernote
  • MySpace
  • Mail.ru
  • Viadeo
  • Line
  • Flipboard
  • Comments
  • SMS
  • Viber
  • Telegram
  • Subscribe
  • Facebook Messenger
  • Kakao
  • LiveJournal
  • Yammer
  • Edgar
  • Fintel
  • Mix
  • Instapaper
  • Copy Link
  • Truth
  • gab-logo Gab
  • Gettr
  • Baidu
  • Mastodon
  • Threads
  • Bluesky
Share via
  • Tumblr
  • VKontakte
  • Print
  • Email
  • Reddit
  • Buffer
  • Love This
  • Weibo
  • Pocket
  • Xing
  • Odnoklassniki
  • WhatsApp
  • Meneame
  • Blogger
  • Amazon
  • Yahoo Mail
  • Gmail
  • AOL
  • Newsvine
  • HackerNews
  • Evernote
  • MySpace
  • Mail.ru
  • Viadeo
  • Line
  • Flipboard
  • Comments
  • SMS
  • Viber
  • Telegram
  • Subscribe
  • Facebook Messenger
  • Kakao
  • LiveJournal
  • Yammer
  • Edgar
  • Fintel
  • Mix
  • Instapaper
  • Copy Link
  • Truth
  • gab-logo Gab
  • Gettr
  • Baidu
  • Mastodon
  • Threads
  • Bluesky