• Privacy Policy
  • About Us
  • Contact Us
Climate Change Dispatch
  • Home
  • Videos
  • Who We Are
  • Facts Vs. Fearmongering
    • Real science vs Junk Science
      • 1100-plus Peer-Reviewed Studies
      • Michael Crichton: Aliens Cause Global Warming
      • Climate change and its causes
      • Climate Science Primer
      • CO2 is not pollution
      • Deceptive Surface Temperature Records
      • Editorial: Great Global Warming Hoax
      • Rules for Climate Radicals: Part 1
      • Rules for Climate Radicals: Part 2
      • Rules for Climate Radicals: Part 3
      • Why CO2 Is A Minor Player In Global Climate
      • Why Politicized Science Is So Dangerous
    • Facts Not Fear
      • A Simple Question For Climate Alarmists
      • Climate Change – The Facts
      • Climate Change Fears Are Empirically Baseless
      • Global Warming 101
      • Global Warming Q&A
      • Understanding The Medieval Warm Period
      • Ocean Cycles and Climate
      • Overview of Plate Climatology Theory
      • Precautionary Principle
      • Should We Celebrate Carbon Dioxide?
      • The Skeptics Handbook
      • Weather Versus Climate
      • Why I’m a GW skeptic
      • Winning the climate debate with facts
      • Why Aliens Cause Global Warming
    • Greenhouse FAQs
      • CO2, Plants, & Industry
      • How much have temps changed?
      • How much have temps changed?
      • How much have temps changed?
      • Is global warming real?
      • Measuring temperature
      • Swimming in CO2?
      • Scientists urge caution?
      • Today’s warming trend
      • Variations in temperature
    • Gore’s Greatest Goofs
      • Deconstructing the Truth
      • Fact-Checking Al Gore’s Latest Predictions
      • How Gore Created The Global Warming Hoax
    • Inside Real Climate
      • Closer look at the 97% Consensus
      • GW’s Amazing Story
      • IPCC gets failing grade
      • Real Climate Exposed!
      • Truth about Real Climate
      • We’ve Been Conned
      • What is there a 97% consensus about?
    • Behind the IPCC
      • 1,000 Scientists Dissent
      • Climategate: Caught Green-Handed!
      • Climategate Inquiries
      • Climategate Inquiries 2
      • NIPCC Report Now Available
      • Understanding the Climategate Inquiries
  • Submissions
  • Contact Us
No Result
View All Result
  • Home
  • Videos
  • Who We Are
  • Facts Vs. Fearmongering
    • Real science vs Junk Science
      • 1100-plus Peer-Reviewed Studies
      • Michael Crichton: Aliens Cause Global Warming
      • Climate change and its causes
      • Climate Science Primer
      • CO2 is not pollution
      • Deceptive Surface Temperature Records
      • Editorial: Great Global Warming Hoax
      • Rules for Climate Radicals: Part 1
      • Rules for Climate Radicals: Part 2
      • Rules for Climate Radicals: Part 3
      • Why CO2 Is A Minor Player In Global Climate
      • Why Politicized Science Is So Dangerous
    • Facts Not Fear
      • A Simple Question For Climate Alarmists
      • Climate Change – The Facts
      • Climate Change Fears Are Empirically Baseless
      • Global Warming 101
      • Global Warming Q&A
      • Understanding The Medieval Warm Period
      • Ocean Cycles and Climate
      • Overview of Plate Climatology Theory
      • Precautionary Principle
      • Should We Celebrate Carbon Dioxide?
      • The Skeptics Handbook
      • Weather Versus Climate
      • Why I’m a GW skeptic
      • Winning the climate debate with facts
      • Why Aliens Cause Global Warming
    • Greenhouse FAQs
      • CO2, Plants, & Industry
      • How much have temps changed?
      • How much have temps changed?
      • How much have temps changed?
      • Is global warming real?
      • Measuring temperature
      • Swimming in CO2?
      • Scientists urge caution?
      • Today’s warming trend
      • Variations in temperature
    • Gore’s Greatest Goofs
      • Deconstructing the Truth
      • Fact-Checking Al Gore’s Latest Predictions
      • How Gore Created The Global Warming Hoax
    • Inside Real Climate
      • Closer look at the 97% Consensus
      • GW’s Amazing Story
      • IPCC gets failing grade
      • Real Climate Exposed!
      • Truth about Real Climate
      • We’ve Been Conned
      • What is there a 97% consensus about?
    • Behind the IPCC
      • 1,000 Scientists Dissent
      • Climategate: Caught Green-Handed!
      • Climategate Inquiries
      • Climategate Inquiries 2
      • NIPCC Report Now Available
      • Understanding the Climategate Inquiries
  • Submissions
  • Contact Us
No Result
View All Result
Climate Change Dispatch
No Result
View All Result

Trillions Spent On ‘Climate Change’ Using Faulty Temperature Data, Climate Experts Say

by Katie Spence
January 29, 2024, 1:48 PM
in News and Opinion
Reading Time: 6 mins read
A A
6

weather station temperatureTo preserve a “livable planet,” the Earth can’t warm more than 1.5 degrees Celsius above preindustrial levels, the United Nations warns.

Failure to maintain that level could lead to several catastrophes, including increased droughts and weather-related disasters, more heat-related illnesses and deaths, and less food and more poverty, the National Aeronautics and Space Administration (NASA) cautions. [emphasis, links added]

To avert the looming tribulations and limit global temperature increases, 194 member states and the European Union in 2016 signed the U.N. Paris Agreement, a legally binding international treaty to “substantially reduce global greenhouse gas emissions.”

After the agreement, global spending on climate-related projects increased exponentially.

In 2021 and 2022, the world’s taxpayers spent, on average, $1.3 trillion each year, according to the nonprofit advisory group Climate Policy Initiative.

That’s more than double the spending rate in 2019 and 2020, which came in at $653 billion per year, and it’s significantly up from the $364 billion per year in 2011 and 2012, the report found.

Despite the money pouring in, the National Oceanic and Atmospheric Administration (NOAA) reported that 2023 was the hottest year on record.

NOAA’s climate monitoring stations found that the Earth’s average land and ocean surface temperature in 2023 was 1.35 degrees Celsius above the preindustrial average.

“Not only was 2023 the warmest year in NOAA’s 174-year climate record—it was the warmest by far,” said Sarah Kapnick, NOAA’s chief scientist.

“A warming planet means we need to be prepared for the impacts of climate change that are happening here and now, like extreme weather events that become both more frequent and severe.”

But a growing chorus of climate scientists are saying the temperature readings are faulty and that the trillions of dollars pouring in are based on a problem that doesn’t exist.

More than 90 percent of NOAA’s temperature monitoring stations have a heat bias, according to Anthony Watts, a meteorologist, senior fellow for environment and climate at the Heartland Institute, author of climate website Watts Up With That, and director of a study that examined NOAA’s climate stations.

“And with that large of a number, over 90 percent, the methods that NOAA employs to try to reduce this don’t work because the bias is so overwhelming,” Mr. Watts told The Epoch Times.

“The few stations that are left that are not biased because they are, for example, outside of town in a field and are an agricultural research station that’s been around for 100 years … their data gets completely swamped by the much larger set of biased data. There’s no way you can adjust that out.”

Meteorologist Roy Spencer agreed.

“The surface thermometer data still have spurious warming effects due to the urban heat island, which increases over time,” Mr. Spencer said.

He is the principal research scientist at the University of Alabama, the U.S. Science Team leader for the Advanced Microwave Scanning Radiometer (AMSR-E) on NASA’s Aqua satellite, and the recipient of NASA’s Exceptional Scientific Achievement Medal for his work with satellite-based temperature monitoring.

Mr. Spencer also said that computerized climate models used to drive changes in energy policy are even more faulty.

John Shewchuk, a certified consulting meteorologist, said the problems with temperature readings go beyond heat bias. The retired Lt. Col. was an advanced weather officer in the Air Force.

“After seeing many reports about NOAA’s adjustments to the USHCN [U.S. Historical Climatology Network] temperature data, I decided to download and analyze the data myself,” Mr. Shewchuk told The Epoch Times.

“I was able to confirm what others have found. It is obvious that, overall, the past temperatures were cooled while the present temperatures were warmed.”

Mr. Shewchuk contends that NOAA and NASA have adjusted historical temperature data in such a way as to make the past appear colder and, by so doing, make the current warming trend more pronounced.

Faulty Temperature Readings

The urban heat island effect causes higher temperatures in areas where there are more buildings, roads, and other forms of infrastructure that absorb and then radiate the sun’s heat, according to the Environmental Protection Agency (EPA).

The agency estimates that “daytime temperatures in urban areas are 1–7 degrees Fahrenheit higher than temperatures in outlying areas, and nighttime temperatures are about 2–5 degrees Fahrenheit higher.”

Consequently, NOAA requires all its climate observation stations to be located at least 100 feet away from elements such as concrete, asphalt, and buildings.

However, in March 2009, Mr. Watts released a report that showed that 89 percent of NOAA’s stations had heat bias issues due to being located within 100 feet of those elements, and many were located by airport runways.

“We found stations located next to the exhaust fans of air conditioning units, surrounded by asphalt parking lots and roads, on blistering-hot rooftops, and near sidewalks and buildings that absorb and radiate heat,” Mr. Watts said.

“We found 68 stations located at wastewater treatment plants, where the process of waste digestion causes temperatures to be higher than in surrounding areas.”

The report concluded that the U.S. temperature record was unreliable, and, because it was considered “the best in the world,” global temperature databases were also “compromised and unreliable.”

Following the report, the U.S. Office of Inspector General (OIG) and the U.S. Government Accountability Office confirmed Mr. Watt’s findings and said NOAA was taking steps to address the issues.

“NOAA acknowledges that there are problems with the USHCN data due to biases introduced by such means as undocumented site relocation, poor siting, or instrument changes,” the OIG report states.

“All of the experts thought that an improved, modernized climate reporting system is necessary to eliminate the need for data adjustments.”

Despite the assurances, Mr. Watts had doubts about NOAA addressing the issues and in April and May of 2022, he and his team revisited many of the same temperature stations they’d observed in 2009.

Mr. Watts published his findings in a new study, on July 27, 2022. It found that even more, approximately 96 percent, of NOAA’s temperature stations still failed to meet its standards.

“There are two main biases in the surface temperature network for the United States, and most likely the world, that I have identified,” Mr. Watts said.

“The biggest bias is the urban heat island effect. What happens is that because heat is retained by the surfaces and released into the air at night, the night’s low temperature is not as low as it could be if the thermometer were outside of town and in a field.”
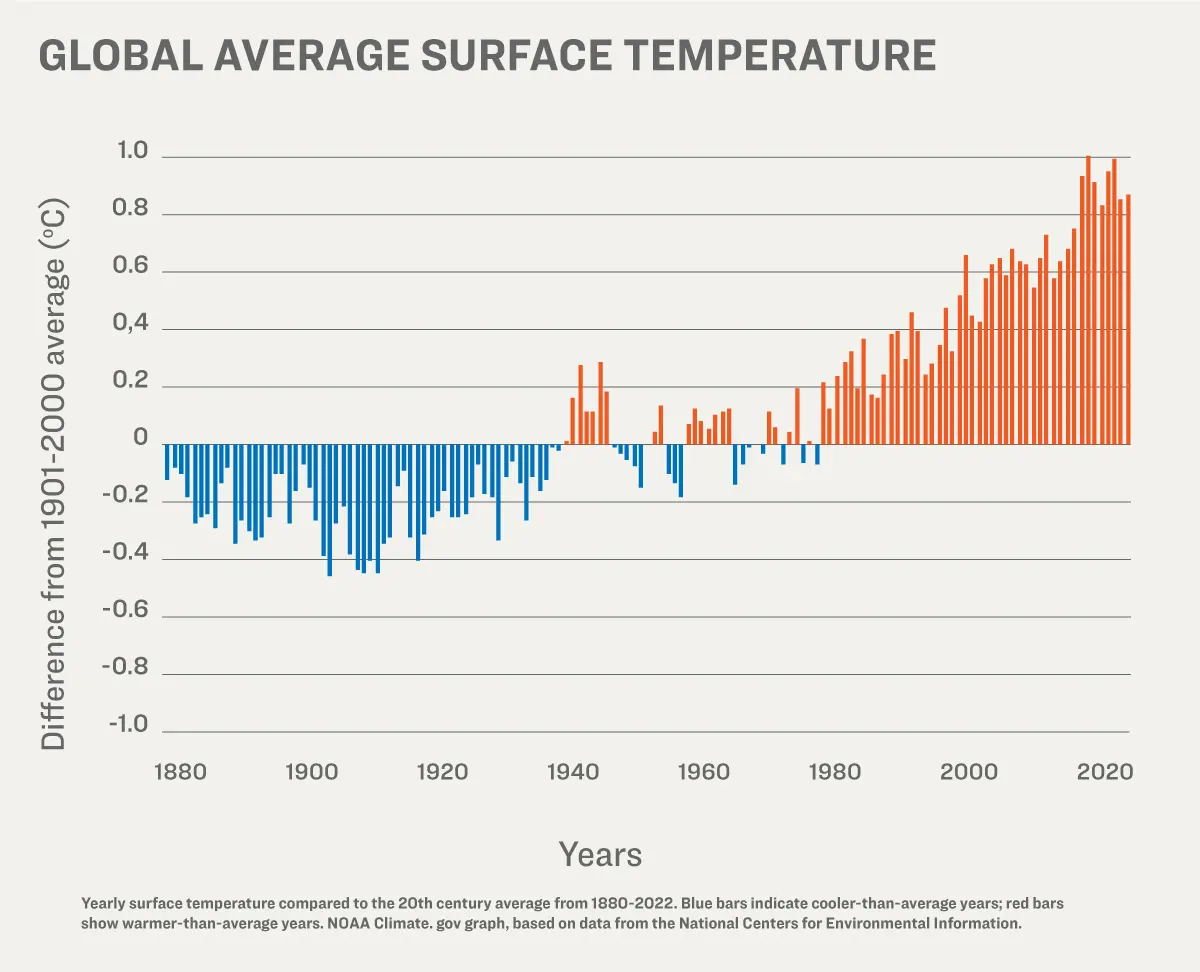
Global average surface temperatures have been variable, but show an increasing trend in recent decades. Source NOAA

Over the years, he said, more and more infrastructure has been built up around the thermometer locations, and at night, the asphalt and concrete release the absorbed heat and push up the temperature.

“You can look at any set of climate data, no matter who produces it, and you can see this effect. The low temperatures are trending upward much faster, and the high temperatures are virtually unchanged. But it’s the average temperature that’s being used to track climate change,” Mr. Watts said.

He said that even though both NOAA and NASA claim they can adjust their data to account for the urban heat island effect, the bias is impossible to overcome because the problem impacts 96 percent of surface stations.

He said the few thermometers located at climate stations not experiencing a heat bias show half the rate of warming currently being reported.

Top image shows a rural temperature station.

Read rest at Epoch Times
  • Truth
  • Twitter
  • Facebook
  • LinkedIn
  • Gettr
  • Threads
  • gab-logo Gab
  • Mastodon
  • Buffer
  • Telegram
  • Email
  • Copy Link
  • Share Using More Networks…

Popular Posts

Bipolar

New Study: Ice Core Data Shows Modern Warming Is Statistically Unremarkable

Mar 05, 2026
Energy

Climate Science’s Biggest Shift In Decades: IPCC’s RCP8.5 Is Officially Dead

Apr 29, 2026
Electric Vehicles (EVs)

The ‘Green’ Scam Of The Century: How ‘Renewables’ Increase Fossil Fuel Demands

Oct 23, 2024

Comments 6

  1. autodoprava do 3.5 tuny says:
    2 years ago

    Excellent goods from you, man. I’ve understand your stuff previous to and you are just extremely wonderful.
    I really like what you’ve acquired here, really like what you are stating and the way in which you say
    it. You make it enjoyable and you still care for to keep it
    smart. I can’t wait to read far more from you. This is actually a tremendous
    site.

    Reply
  2. Gator says:
    3 years ago

    JOURNAL OF GEOPHYSICAL RESEARCH

    http://onlinelibrary.wiley.com/doi/10.1029/2010JD015146/abstract

    According to the best-sited stations, the diurnal temperature range in the lower 48 states has no century-scale trend.

    The current rating of surface stations (82.5% surveyed) as of 07/30/2012

    CRN Rating:
    CRN1-2, 7.9%
    CRN3-5, 92.1%

    1 Flat and horizontal ground surrounded by a clear surface with
    a slope below 1/3 (<19°). Grass/low vegetation ground cover
    3 degrees.

    2 Same as Class 1 with the following differences. Surrounding
    Vegetation 5°.

    3 (error 1°C) ‐ Same as Class 2, except no artificial heating
    sources within 10 meters.

    4 (error ≥2°C) ‐ Artificial heating sources <10 meters

    5 (error ≥5°C) ‐ Temperature sensor located next to/above an
    artificial heating source, such a building, roof top, parking lot,
    or concrete surface

    https://pielkeclimatesci.files.wordpress.com/2011/07/r-367.pdf

    Reply
  3. Richard Greene says:
    3 years ago

    The article is BS

    Trillions were wasted

    But not because of poor siting of US land weather stations wgich most likely overestimated the warming trednd

    The author organized the survey of US weather station siting and wants to make himself seem much more important — stolen valor.

    Reply
    • SPURWING PLOVER says:
      3 years ago

      They screw around with the equipment knowing Biden the Blunder will give them Money

      Reply
  4. Mark Wild says:
    3 years ago

    The other issue is why pick the pre-industrial period, a mini ice age, as a datum?

    Reply
  5. SPURWING PLOVER says:
    3 years ago

    Like setting up the interments in Asphalt Parking lots or exuast vents This is Cheating and those who do this should have the money cut off by 100%

    Reply

Comments are welcome! Those that add no discussion value may be removed.Cancel reply

Stay Connected!

gab-logo

Donate Today

Beating back the alarmist narrative takes time and money. Please donate today to help!

Subscribe To CCD Via Email!

Subscribe to receive a digest of daily stories, or get instant notifications. Check your Junk/Spam folder for a verification email.

Recent Posts

  • nasem buildingState AGs Accuse NASEM Of Producing ‘Biased’ Report To Aid Climate Lawfare
    Aug 27, 2026
    State AGs allege a NASEM biased climate report was shaped by funders and advocates tied to climate litigation and designed to aid plaintiffs. […]
  • puppet media moneyFair Question: Who’s Really Paying For The Media’s Climate Reporting?
    Aug 27, 2026
    Green-advocacy groups are pouring millions into climate reporting grants, raising questions about media bias and claims of editorial independence. […]
  • wildfire calif power linesNewsom’s Wildfire Liability Plan Puts Utilities, Victims On A Collision Course
    Aug 27, 2026
    Newsom wants to rewrite California’s wildfire liability rules, pitting utility costs against compensation for victims when power equipment sparks fires. […]
  • flat tire califCalifornia’s New Efficiency Standards Make Replacement Tires A Luxury Item
    Aug 27, 2026
    The new California tire efficiency standards could sharply raise replacement costs while eliminating much of today’s tire market. […]
  • super el nino balloonDeutsche Welle’s ‘Super El Niño’ Climate Scare Is Mostly Hot Air
    Aug 26, 2026
    A strong El Niño may affect global weather, but that doesn’t mean climate change is fueling another worldwide extreme-weather crisis. […]
  • nancy pelosiPelosi Family Bets Millions On Company Poised To Cash In On AI Power Crunch
    Aug 26, 2026
    Nancy Pelosi's husband invested millions in Bloom Energy, a fuel-cell company positioned to profit from AI’s soaring electricity demand. […]
  • atlantic hurricane2026 Atlantic Hurricane Activity Is 85% Below Normal. Cue The Alarmist Crickets
    Aug 26, 2026
    Atlantic hurricane activity is 85% below normal as El Niño, Saharan dust, and other natural factors suppress tropical storm development. […]
  • rivian tow truck$63 And An Hour Later: CA Influencer Learns The Reality Of EV Charging
    Aug 26, 2026
    A California influencer spent $63 and more than an hour charging her Rivian, highlighting how electric vehicle charging costs can rival gas. […]
  • carney Jinping chinaCarney’s Climate Obsession Comes Home To Roost In U.S.-Canada Trade War
    Aug 24, 2026
    Canada’s climate agenda has throttled domestic energy and left it increasingly vulnerable as Carney’s trade fight with the U.S. heats up. […]
  • net zero tombstoneNet Zero Is Dead And Gone
    Aug 24, 2026
    America’s net-zero movement is collapsing as banks abandon climate pledges and economic reality catches up with the green energy agenda. […]

Books You May Like

Cold Facts About the Great Global Warming Scam

Climate prn book

Sunset on Net Zero

Canary in a Climate World

Have a suggestion? Let us know! We swap out books based on your input. We participate in the Amazon Services LLC Associates Program. See here.

  • Privacy Policy
  • DMCA Policy
  • About Us
  • Contact Us

© Portions copyright Climate Change Dispatch

No Result
View All Result
  • Home
  • Videos
  • Who We Are
  • Facts Vs. Fearmongering
    • Real science vs Junk Science
      • 1100-plus Peer-Reviewed Studies
      • Michael Crichton: Aliens Cause Global Warming
      • Climate change and its causes
      • Climate Science Primer
      • CO2 is not pollution
      • Deceptive Surface Temperature Records
      • Editorial: Great Global Warming Hoax
      • Rules for Climate Radicals: Part 1
      • Rules for Climate Radicals: Part 2
      • Rules for Climate Radicals: Part 3
      • Why CO2 Is A Minor Player In Global Climate
      • Why Politicized Science Is So Dangerous
    • Facts Not Fear
      • A Simple Question For Climate Alarmists
      • Climate Change – The Facts
      • Climate Change Fears Are Empirically Baseless
      • Global Warming 101
      • Global Warming Q&A
      • Understanding The Medieval Warm Period
      • Ocean Cycles and Climate
      • Overview of Plate Climatology Theory
      • Precautionary Principle
      • Should We Celebrate Carbon Dioxide?
      • The Skeptics Handbook
      • Weather Versus Climate
      • Why I’m a GW skeptic
      • Winning the climate debate with facts
      • Why Aliens Cause Global Warming
    • Greenhouse FAQs
      • CO2, Plants, & Industry
      • How much have temps changed?
      • How much have temps changed?
      • How much have temps changed?
      • Is global warming real?
      • Measuring temperature
      • Swimming in CO2?
      • Scientists urge caution?
      • Today’s warming trend
      • Variations in temperature
    • Gore’s Greatest Goofs
      • Deconstructing the Truth
      • Fact-Checking Al Gore’s Latest Predictions
      • How Gore Created The Global Warming Hoax
    • Inside Real Climate
      • Closer look at the 97% Consensus
      • GW’s Amazing Story
      • IPCC gets failing grade
      • Real Climate Exposed!
      • Truth about Real Climate
      • We’ve Been Conned
      • What is there a 97% consensus about?
    • Behind the IPCC
      • 1,000 Scientists Dissent
      • Climategate: Caught Green-Handed!
      • Climategate Inquiries
      • Climategate Inquiries 2
      • NIPCC Report Now Available
      • Understanding the Climategate Inquiries
  • Submissions
  • Contact Us

© 2026 Climate Change Dispatch

 
Share via
  • Facebook
  • Twitter
  • Pinterest
  • LinkedIn
  • Digg
  • Tumblr
  • VKontakte
  • Print
  • Email
  • Reddit
  • Buffer
  • Love This
  • Weibo
  • Pocket
  • Xing
  • Odnoklassniki
  • WhatsApp
  • Meneame
  • Blogger
  • Amazon
  • Yahoo Mail
  • Gmail
  • AOL
  • Newsvine
  • HackerNews
  • Evernote
  • MySpace
  • Mail.ru
  • Viadeo
  • Line
  • Flipboard
  • Comments
  • SMS
  • Viber
  • Telegram
  • Subscribe
  • Facebook Messenger
  • Kakao
  • LiveJournal
  • Yammer
  • Edgar
  • Fintel
  • Mix
  • Instapaper
  • Copy Link
  • Truth
  • gab-logo Gab
  • Gettr
  • Baidu
  • Mastodon
  • Threads
  • Bluesky
Share via
  • Tumblr
  • VKontakte
  • Print
  • Email
  • Reddit
  • Buffer
  • Love This
  • Weibo
  • Pocket
  • Xing
  • Odnoklassniki
  • WhatsApp
  • Meneame
  • Blogger
  • Amazon
  • Yahoo Mail
  • Gmail
  • AOL
  • Newsvine
  • HackerNews
  • Evernote
  • MySpace
  • Mail.ru
  • Viadeo
  • Line
  • Flipboard
  • Comments
  • SMS
  • Viber
  • Telegram
  • Subscribe
  • Facebook Messenger
  • Kakao
  • LiveJournal
  • Yammer
  • Edgar
  • Fintel
  • Mix
  • Instapaper
  • Copy Link
  • Truth
  • gab-logo Gab
  • Gettr
  • Baidu
  • Mastodon
  • Threads
  • Bluesky