The HadCRUT3 global temperature trend was recorded as 0.03°C per decadeduring the global warming hiatus years of 2000-2014 (Scafetta, 2022). [emphasis, links added]
This was increased to 0.08°C per decade by version 4, as the overseers of the HadCRUT data conveniently added 0.1°C to 0.2°C to the more recent anomalies.
Today, in HadCRUT5, the 2000-2014 temperature trend has been adjusted up to 0.14°C per decade when using the computer model-infilling method.
So, within the last decade, a 15-year temperature trend has been changed from a pause to strong warming.
Once data are “adjusted” they cease to be data. In this case, they become what the manipulators realize they needed to be to support the narrative.
Hadley Center is hardly the only guilty party.
Cutting CO2 emissions and warming are assumed to go hand in hand, but the analysis finds enormous costs would yield only tiny temperature reductions. […]
The NYT rushed to blame climate change for the Nepal glacier collapse, but evidence points instead to geological failure and vulnerable infrastructure. […]
Maryland electricity prices have soared as state policies shutter reliable generation, increase dependence on imported power, and push wind and solar. […]
Greta Thunberg’s “How dare you?” comes full circle as costly climate policies undermine energy security, living standards and prosperity worldwide. […]
Late-summer Arctic sea ice extent has barely changed in 20 years, as Europe sees low burned area and Atlantic cyclone activity remains well below normal. […]


 Adjustments add significant warming to 21st-century temperature trends.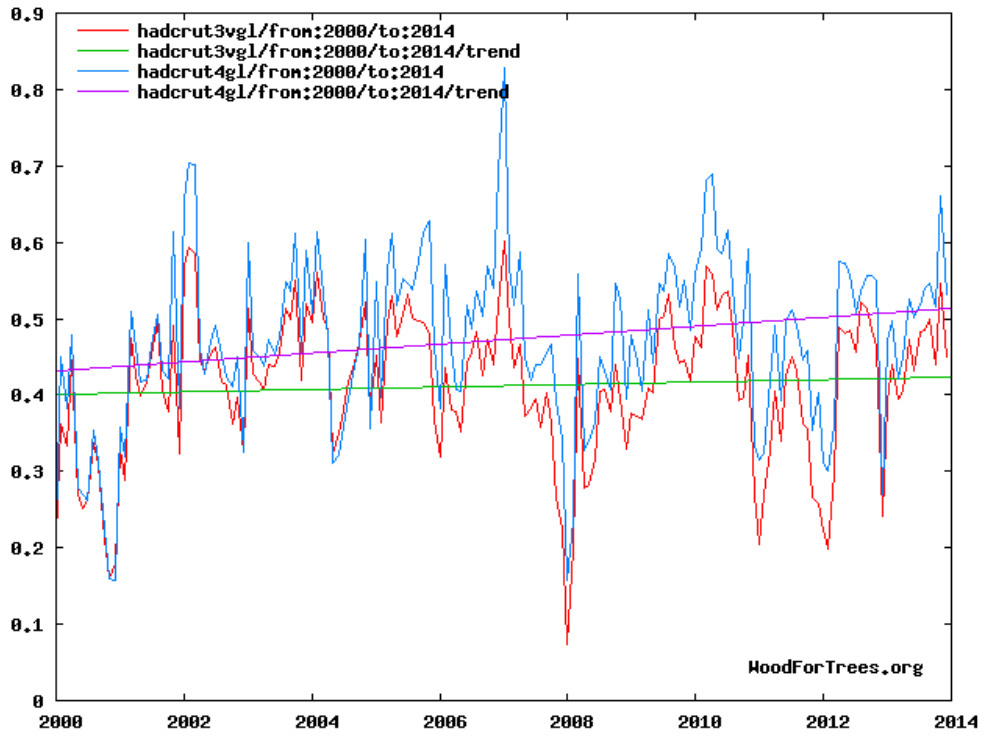







Once data are “adjusted” they cease to be data. In this case, they become what the manipulators realize they needed to be to support the narrative.
Hadley Center is hardly the only guilty party.