The image [below] shows global tropical cyclone landfalls from 1980 through 2020 — via the IBTrACS global best-track data — and plots the difference between the two ENSO phases. [some emphasis, links added]
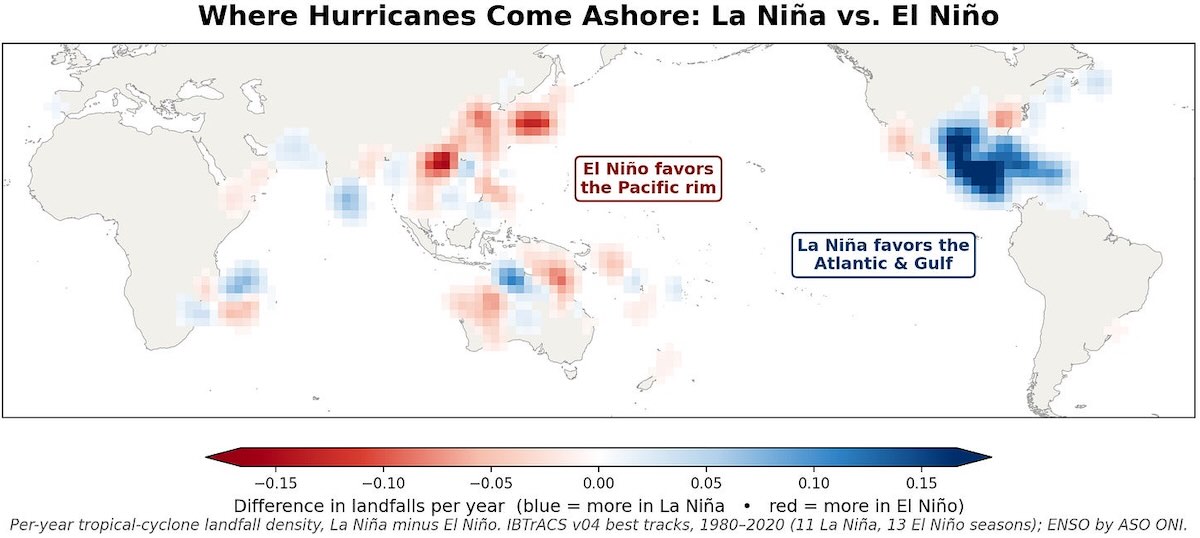
Blue indicates coasts where more storms make landfall during the La Niña phase, and red shows coasts where El Niño has more landfalls — the darker the shading, the wider the gap between phases — using the NOAA Climate Prediction Center ONI v5 ENSO index.
For the Caribbean, Central America, and U.S. Gulf and East coasts, the La Niña phase has about twice as many landfalls as during El Niño — 2.1× across the basin and 1.4× along the U.S. coastline.
The Northwest Pacific, including the Philippines, China, Japan, and Korea, the eastern Pacific toward Mexico, and the South Pacific islands experience more landfalls during the El Niño phase.
El Niño means fewer Atlantic hurricanes. But worldwide, El Niño years have more tropical cyclone activity.
Today’s post explores what the emerging El Niño means for tropical cyclone activity and its implications for U.S. damage potential.
1. What Happens in the Atlantic
William Gray1 of Colorado State University established the core dynamical understanding in the 1980s:
During El Niño, warm waters in the central and eastern equatorial Pacific drive an atmospheric response that strengthens vertical wind shear over the tropical Atlantic, making it difficult for developing storms to intensify.
During La Niña, the pattern flips: wind shear is reduced, and the Atlantic main development region is more active.
Accumulated Cyclone Energy (ACE) is a metric that integrates tropical cyclone frequency and intensity, and the figure below shows that ACE values in the Atlantic are generally higher during the La Niña phase than El Niño — but that does not completely rule out the possibility of a very active El Niño year or an inactive La Niña year.
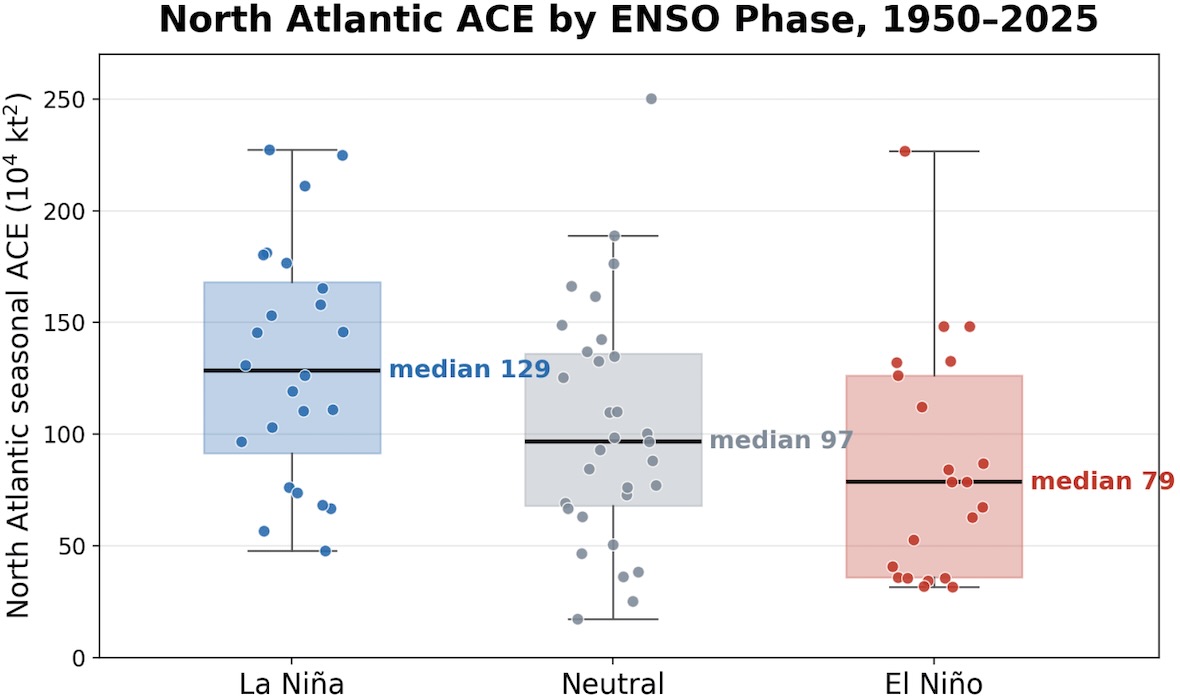
From 1950–2025, the median North Atlantic season had ~129 units of ACE in La Niña years versus ~79 in El Niño years — a ratio of ~1.6×. Neutral years fall in between, at ~97. For major hurricanes, La Niña seasons average ~3.6 annually, and El Niño seasons average ~2.0.
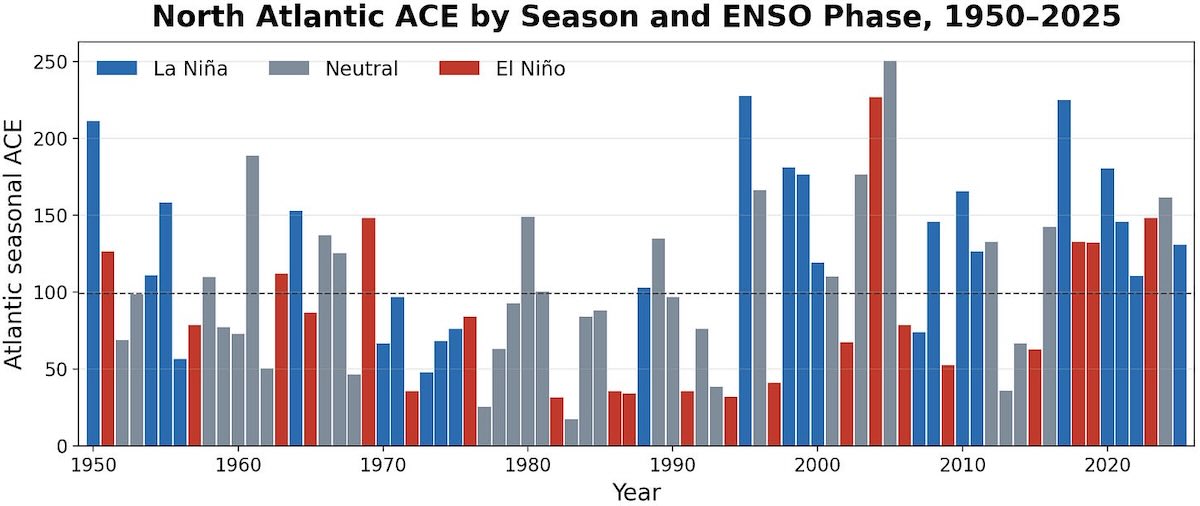
The figure above shows ACE for 1950 to 2025, shaded by ENSO phase. Most El Niño Atlantic seasons fall below the long-term ACE median of 99.4, but not all do, and vice versa for La Niña seasons.
2. U.S. Damage: Updating Our 1999 Analysis
In 1999, Chris Landsea and I published a paper in the Bulletin of the American Meteorological Society, “La Niña, El Niño, and Atlantic Hurricane Damages in the United States.”
We assessed U.S. hurricane losses normalized to 1997 values and by ENSO phase and found a strong relationship: La Niña years had much higher normalized losses.
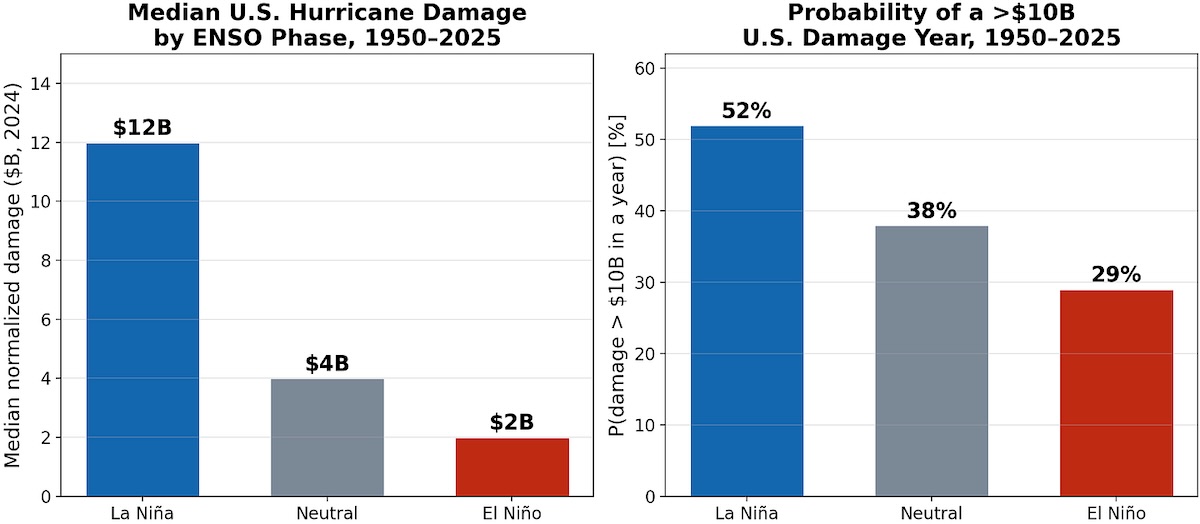
The figure above updates our analysis through 2025 and shows that our original findings have stood the test of time. In fact, the relationship is even stronger than that which we documented in our initial analysis.
- The median La Niña year has ~$12 billion in damage versus ~$2 billion for the median El Niño year — a factor of six difference.
- La Niña years have losses above $10 billion about 52% of the time versus 29% for El Niño years, a 1.8× gap, about what we reported in 1999.
ENSO shifts the odds without removing the possibility of extreme losses. Also, about 40% of years are neutral, with large variability in losses. A very large loss year can strike in any ENSO phase when a major hurricane meets an exposed coast.
3. The Global Picture
Summing all six tropical cyclone basins, the median global season generates more ACE in El Niño years than in La Niña years — about 29% higher. El Niño does not merely relocate the planet’s storm energy; it raises the total — led by the Western Pacific, which is responsible for ~40% of global ACE across years.
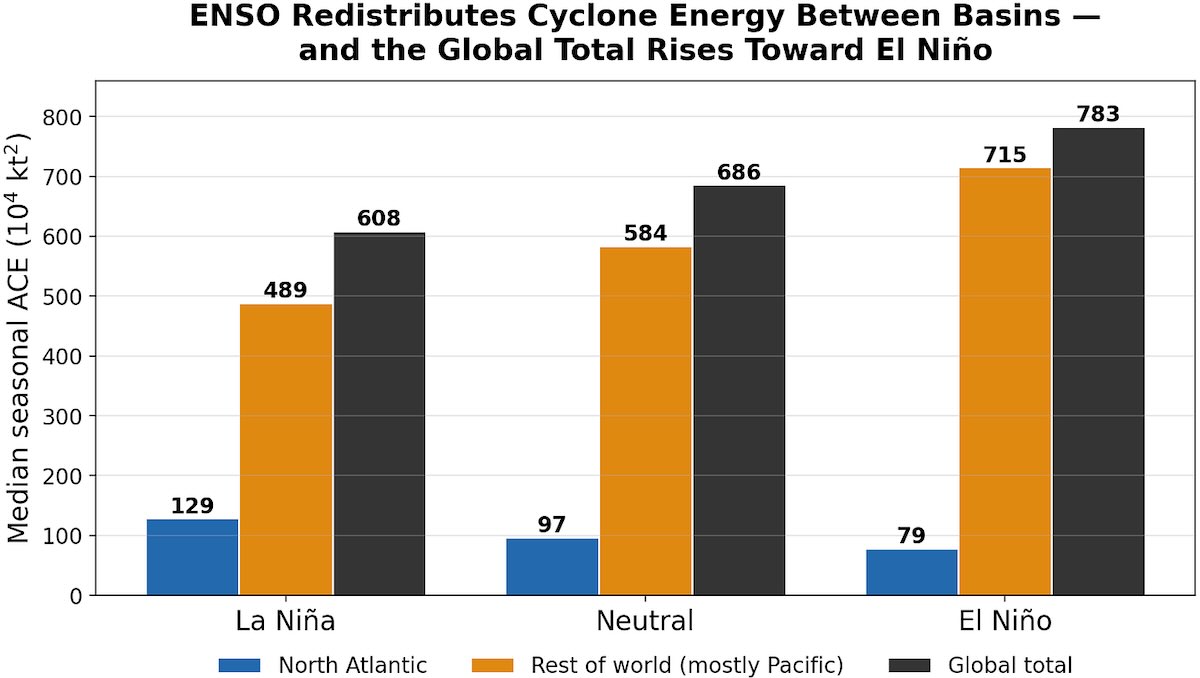
An El Niño therefore has both a strong Atlantic signal and a strong Pacific signal, but in different directions.
Our 1999 paper covered only U.S. losses, but it turns out those losses are a big part of the global story. The figure below shows that global insured losses are significantly influenced by whether or not the U.S. mainland experiences a major hurricane that hits a populated region.2
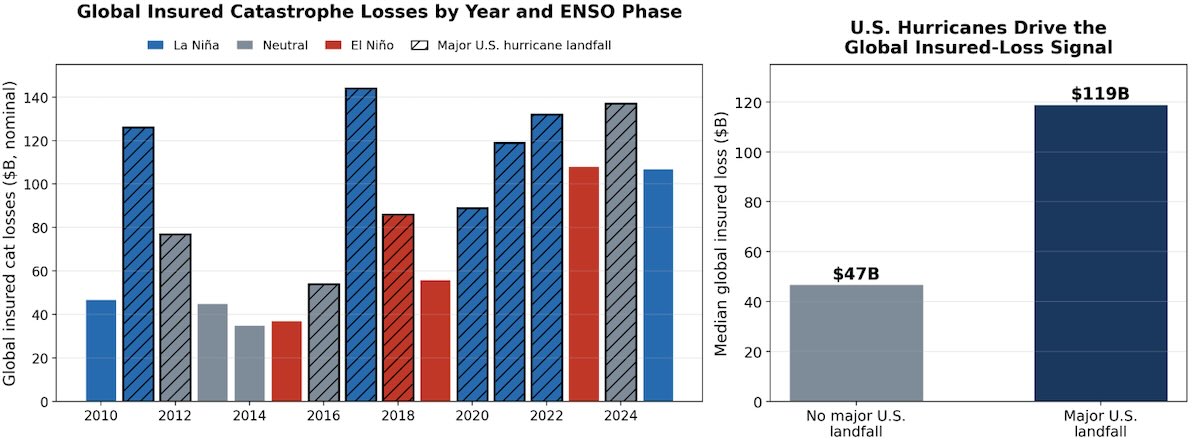
Significantly, globally, El Niño is associated with more tropical cyclone activity, but global economic losses are generally higher in La Niña years.
Where storms hit matters more than how many or how strong. The Pacific generates most of the world’s cyclone energy, but landfalls there cross coastlines with far lower insured values than the U.S. Gulf and Atlantic coasts.
So global losses follow the Atlantic ENSO signal—not the global pattern.
The figure above shows that separating years by whether a major hurricane struck the U.S. coast reveals a [huge difference in insured losses]: Major U.S. hurricane landfall years have a median insured loss of ~$119 billion; non-landfall years have about ~$47 billion — about a 2.5× difference.
The five costliest years — 2017 (Harvey, Irma, Maria), 2024 (Helene, Milton), 2022 (Ian), 2011, and 2021 (Ida) — all featured major U.S. landfalls, and four of the five were La Niña years.
The Honest Broker is written by climate expert Roger Pielke Jr and is reader-supported. If you value what you have read here, please consider subscribing and supporting the work that goes into it.
Read rest at The Honest Broker