 As I’m sure many of my readers are aware, Europe has been having an odd summer as far as temperatures are concerned. The continent has had two major heatwaves this summer; one was in June and the other was in July.
In addition, Greenland has also seen some exceptional “warmth” and lots of ice melt this summer as compared to more recent years.
So, what’s going on? Is climate change to blame? Or, is this a freak of nature?
As with most complicated things in science, the truth is somewhere in between and is not just one way or the other. I hate saying that as a “black and white” person, but it’s an unfortunate fact. One can not make a preconceived notion based on one weather event without looking at a.) the big picture, b.) mechanism, and c.) long-term trends.
The upper air pattern over Europe and Greenland is opposite of what’s been occurring in much of the United States. The U.S. has only had one major heatwave this year, and that in and of itself caused mass hysteria.
For meteorological summer to date, the Lower 48 has been nearly spot on average, via the 1981-2010 mean (Figure 1).¹

Over the last few weeks, “warm air” from the mid-latitudes has been flowing into Greenland causing lots of ice melt on the Greenland ice sheet.
As usual, the media has turned their attention to this and has been having a field day with it. Here are some of the latest attention-grabbing headlines (Figure 2).

By the looks of these headlines, one would think that “the end is near.” However, I can rest assure you that the melting ice in Greenland is nothing to be overly concerned about.
Like most people who are familiar with my site know, I like to do what Joe Bastardi calls the “why before the what.” In other words, I like to explain why something’s happening before I talk about what’s happening. It’s just how I am, and is one of the key reasons to my skepticism of the so-called “climate crisis.”
So, why are we seeing this wacky weather? Hint: it’s mostly due to weather, not climate change!
The why before the what…
For much of the summer, a meteorological phenomenon we call the “North Atlantic Oscillation (NAO),” has been in a predominately negative phase (Figure 3).²

The NAO index is based on the difference between sea-level [air] pressure (SLP) between the “Icelandic Low” and the “Azores High.”³
When the NAO is positive, below-normal 500 millibars (mbar) heights can be found across high-latitude regions like Greenland, Alaska, or the Arctic, while above-normal 500 mbar heights can be found across much of the mid-latitudes; mainly the eastern United States, the North Atlantic, western Europe, and occasionally Russia.³
The opposite occurs with a negative NAO phase.
Positive heights (high pressure) over Greenland during a negative NAO phase mean that there’s sinking air or subsidence in the atmosphere, whereby air is compressed against the surface and consequently warms up.
Occasionally, these “heat domes” or “bubbles” will form over Europe and break away from the jet stream, thus moving poleward, potentially into Greenland.
This natural process occurs with or without doubling carbon dioxide concentrations from pre-industrial levels – sorry activists!
As meteorologist Steven DiMartino of NY NY PA Weather noted, low solar activity for short periods of time has a direct effect on the thermal states of the mesosphere and stratosphere.⁴
When solar activity is low, the mesosphere cools and the stratosphere warms, but the troposphere sees more enhanced 500 mbar blocking patterns with meridional (wavy) jet stream flow.⁴
And when teleconnections like the NAO are negative, the jet stream becomes wavy as blocking patterns emerge like they have this summer.⁴ Low solar activity tends to create an enhanced regime of negative NAO phases.⁴
Warm air over Greenland began to emerge around July 29 which set records at the Summit Station.⁵
By the time temperatures cooled down around August 4th, about 90% of the Greenland ice sheet surface observed melting at least once between the 29th and the 3rd.⁵
July 31st was the most extensive melt day with over 60% of the ice sheet surface seeing melting.⁵ The surface melt extent on July 31 was estimated to be about 984,000 square kilometers (Figure 4).⁶

According to the National Snow & Ice Data Center (NSIDC), melt runoff was estimated to be 55 billion tons during that five-day stretch.⁵ That is 40 billion tons more than the 1981-2010 long-term average for the same interval.⁵
The graph below (Figure 5) from the Danish Meteorological Institute (DMI)shows the daily surface mass balance for the Greenland ice sheet since last September.⁷ As you can see, the mass gains and losses were fairly “normal” from September through early May.
The large blue spikes on the graph (Figure 5) correspond to very large snowfalls on Greenland.
On one day last November, Greenland received about 10 billion tons of new snow, and a couple of days later, Greenland received nearly 12 billion tons of new snow.
The reason I’m pointing this is out is that the largest loss of ice in Greenland this year was 11 billion tons.
Journalists like to put intense focus on a single day or week’s worth of melting in Greenland, yet disregard large mass gains in surface mass balance that occur outside of “melt season.”

This next graph also from DMI (Figure 6) shows both [new] snow accumulation in Greenland and loss of that snow over a one-year period.
This graph shows that on average, snow begins to accumulate on the Greenland ice sheet around September 1st and continues accumulating through the start of June.
Typically, around 550 to 600 gigatons of snow accumulate on Greenland during that time period (see the dark grey line which represents the 1981-2010 average).

As conveyed in Figure 5, Greenland gains about as much ice as it loses every year. However, as shown in Figure 6 directly above, Greenland receives much more snow during the winter than melts during the summer.
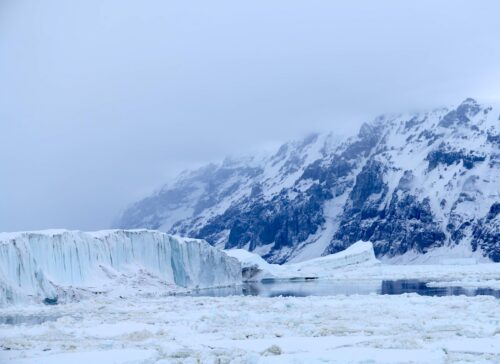
As both the DMI and Tony Heller have pointed out, there are two ways by which Greenland loses ice. That is by either surface melt during summer, or by ice calving off into the ocean (Figure 7).⁸ ⁹
If it wasn’t for either of those two mechanisms and gravity, snow would continue accumulating on Greenland until it reached the tropopause, as snow, let alone most other weather does not occur in the stratosphere or layers aloft.⁹

During summer, many parts of the Greenland ice sheet can get above freezing which means that ice will melt off of the ice sheet. This very basic process is important in keeping the ice sheet in equilibrium.
Melting can be enhanced when Greenland goes through warm spells with a negative NAO, as I explained earlier in this article.
Currently, Greenland loses about 200 gigatons of leftover snow from the winter over the course of the summer melt season.
However, melting of snowfall alone does not keep the ice sheet in balance. This is where “ice calving” comes into play.
Glaciers are like “rivers of ice.” Like ordinary rivers, glaciers flow downhill.
As snow falls on Greenland during the autumn, winter, and spring, the weight of it causes the snow to compress and turn into thick ice.¹⁰ Large amounts of these thick ice masses are called “glaciers.”¹⁰
Because glaciers are so heavy, they flow very slowly downhill towards the ocean where pieces of the ice calve off into the ocean.¹⁰ These pieces of ice, once they calve off, are known as “icebergs.”¹⁰
Last winter had below-average snowfall accumulation in Greenland, while a lot of it has melted off this summer.
Because there was little snowfall accumulation over the cold months, it’s unlikely that this year will catch up with the benchmark year 2012 (Figure 8).
While climate activists are honed in on the melting ice in Greenland this year, going head over heels to generate headlines with mass hysteria, they remained silent during 2017 and 2018 when Greenland was receiving an incredible amount of snow, of which very little melted during the summer months (Figure 9).¹¹ ¹²

So, while natural weather fluctuations can easily explain the ice loss in Greenland back in July and August, could climate change have played a role? Yes, it may actually have!
While I firmly remain skeptical of notions that a.) carbon dioxide has caused most of the warming, b.) we’re in a climate crisis, and c.) extreme weather worsens as the climate warms, I must admit that a warmer average temperature as compared to decades past - whatever the cause - may have enhanced the warmth in Greenland to cause a bit more melting than would have occurred during the 1970s, 1980s, and even the 1990s.
As shown in Figure 10 below, the average temperature in Greenland from seven long-running GHCN stations has warmed by around 1.5°C since observations began in 1880.
The 2000s were the warmest decade on record in Greenland as far as these station measurements go. The 2010s are likely going to go down as the second warmest.
Despite the fact that the 2000s and 2010s will outweigh the 1930s and 1940s by around 0.6°C, the warmth is largely explainable by a positive Atlantic Multidecadal Oscillation (AMO) as Dr. Judith Curry explains here.

The bottom line…
Losses in ice sheet mass balance are what keeps the ice sheet in equilibrium with the gains during the winter.
Whenever climate activists see video footage or read news stories about Greenland ice melt, they climb aboard the crazy train, when in fact, these ice losses are part of the “annual cycle.”
This easily explains short-term fluctuations, but many longer-term changes are mostly influenced by the Atlantic Multidecadal Oscillation.
While climate change - mostly natural with man’s contribution - may have enhanced ice melt via warmer temperatures, it most certainly did NOT cause it.
REFERENCES
[1] “PRISM Temperature Analysis.” Model Labs. Accessed August 11, 2019. https://lab.weathermodels.com/models/prism/monthly.php.
[2] “North Atlantic Oscillation (NAO).” Climate Prediction Center. Accessed August 11, 2019. https://www.cpc.ncep.noaa.gov/products/precip/CWlink/pna/nao.shtml.
[3] “North Atlantic Oscillation (NAO).” National Centers for Environmental Information (NCEI). Accessed August 11, 2019. https://www.ncdc.noaa.gov/teleconnections/nao/.
[4] DiMartino, Steven. “There Is More To This Pattern Than Just Carbon Dioxide.” NY NJ PA Weather. August 10, 2019. Accessed August 11, 2019. https://nynjpaweather.com/public/2019/08/08/there-is-more-to-this-pattern-than-just-carbon-dioxide/.
[5] “Europe’s warm air spikes Greenland Melting to Record Levels.” National Snow and Ice Data Center. August 6, 2019. Accessed August 11, 2019. http://nsidc.org/greenland-today/2019/08/europes-warm-air-spikes-greenland-melting-to-record-levels/.
[6] “Greenland Surface Melt Extent Interactive Chart.” National Snow and Ice Data Center. Accessed August 11, 2019. https://nsidc.org/greenland-today/greenland-surface-melt-extent-interactive-chart/.
[7] “Surface Conditions.” Polar Portal. Accessed August 11, 2019. http://polarportal.dk/en/greenland/surface-conditions/.
[8] “Understanding the Greenland Ice Sheet.” Polar Portal. Accessed August 11, 2019. http://polarportal.dk/en/groenlands-indlandsis/nbsp/viden-om-groenlands-indlandsis/.
[9] Heller, Tony. “Democracy Dies In Darkness.” The Deplorable Climate Science Blog. August 10, 2019. Accessed August 11, 2019. https://realclimatescience.com/2019/08/distinguishing-between-climate-and-weather-2/.
[10] “What is a glacier?” National Snow and Ice Data Center. Accessed August 11, 2019. https://nsidc.org/cryosphere/glaciers/questions/what.html.
[11] “Current Surface Mass Budget of the Greenland Ice Sheet.” DMI. Accessed August 11, 2019. https://web.archive.org/web/20170831040633/https://www.dmi.dk/en/groenland/maalinger/greenland-ice-sheet-surface-mass-budget/.
[12] “Current Surface Mass Budget of the Greenland Ice Sheet.” DMI. Accessed August 11, 2019. https://web.archive.org/web/20180831033538/https://www.dmi.dk/en/groenland/maalinger/greenland-ice-sheet-surface-mass-budget/.
Read more at Chris Martz Weather


Climate change is not human made or dangerous, and overall, the 1930s were warmer globally than the modern decade. Also the reason the world warmed throughout the 20th century is because we have just come out of the little ice age into a modern warm period. And the medieval warm period was still warmer. There are articles about this, on this website.
Makena, that sounds very logical, factual, and data based.
So obviously, you would be labeled a Denier by the Global Alarmist faithfuls.