
As New England digs out from a historic blizzard, today’s post takes a deep and technical dive into recent research — Chen et al. 20251 — claiming that Nor’easters have become detectably more intense over recent decades. [some emphasis, links added]
That research asserts:
Our analysis of nor’easter characteristics reveals that the strongest nor’easters are becoming stronger . . .
Taking advantage of AI tools, I have replicated and extended the analysis. As is far too common in high-profile climate research, the top-line claims of the paper do not survive scrutiny.
Public commentary by the paper’s senior author and subsequent media reporting provide a case study in how uncertain and ambiguous findings are turned into strong claims expressed with absolute certainty.
Grab your coffee, settle in, and let’s take a deep dive.
Last July, a paper in PNAS by Chen and colleagues was accompanied by widespread media coverage claiming that the new paper was the first and last word on trends in the intensification of nor’easters.
For example:
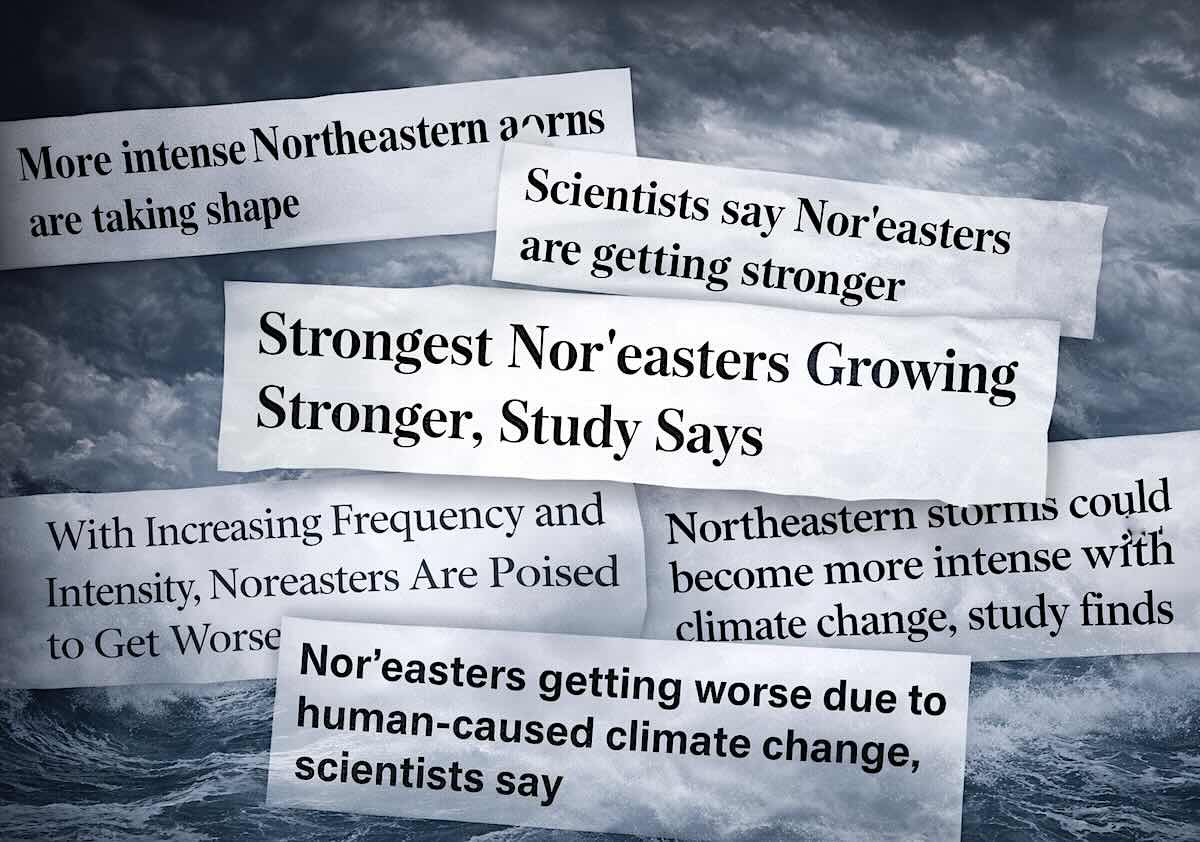
- Live Science reported that nor’easters “have become 20% more destructive in the last 80 years.”
- Inside Climate News declared that “the strongest ones are clearly getting stronger.”
- The Weather Network, revisiting the study in December, announced that nor’easters are “growing more intense and producing more rain and snow than ever before.”
- The University of Pennsylvania’s press release on the paper called its findings “unquestionable.”
- Michael E. Mann, the paper’s senior author and a climate scientist at the University of Pennsylvania, in his accompanying blog post, stated that intensification “can now be seen in the observations.”
A closer reading of the paper shows that none of the above claims is a true reflection of what the paper actually says, supported by a simple extension of its methods and analysis. …snip…
Nor’easters are among the most consequential weather events affecting the densely populated U.S. East Coast, into New England and the Canadian maritime provinces.
If the most intense storms have become detectibly more intense, and are expected to continue to do so, that has important implications for urban planning and decision-making in other settings.
The bottom line: Chen et al. take on a worthwhile question, but its headline claims, and those that followed publication, go meaningfully beyond what the data can currently support.
Follow-on public discussion by its senior authors and in the media depart even further from what evidence and analysis can support. Worthwhile findings of uncertainty and ambiguity are transformed into unquestioned certainty in support of a narrative that everything is getting worse.
What Chen et al. Did and What They Found
Chen et al. use ERA5 — the European Centre for Medium-Range Weather Forecasts’ global reanalysis — to construct a historical record of nor’easters from 1940 to 2025.
A nor’easter is a powerful, large-scale low-pressure storm system, called an extratropical cyclone (ETC), that forms along the east coast of North America, characterized by winds blowing from the northeast (giving such storms their common name), often accompanied by heavy rain or snow.
A reanalysis can be understood as a retrospective weather forecast: historical weather observations — from sources such as weather balloons, ships, land stations, and eventually satellites — are fed into a numerical weather model to reconstruct the historical state of the global atmosphere.
Ideally, the result is a consistent, gridded dataset of weather variables covering the entire planet, filling in gaps where direct observations were never made. ERA5 is the most widely used reanalysis in climate research.
As we will see, going back further in time, reanalysis quality is far from uniform, and the creators of such datasets are warned about their use for long-term trend analyses.
Using the ERA5 reanalysis, Chen et al. identify 900 storms from 1940 to 20242 that meet their criteria for an ETC. With this time series, they apply a statistical technique called quantile regression to explore whether the intensity of the strongest ETCs has changed over time.
Quantile regression allows for a focus on extremes rather than just averages, enabling quantification of whether, for instance, the intensity of the top 10%, top 5%, or top 1% of storms has detectably changed over time.
Chen et al. report that from 1940–2025 record, the peak wind speeds of the most intense nor’easters — those in the top 1% (that is, about 9 storms) — increased by approximately 6%, from ~31 m/s (~69 mph) at the start of the record to ~33 m/s (~74 mph) by its end. The trend for the top quarter of storms (75th percentile and above) is similar in magnitude.
The authors then apply a damage-scaling relationship to translate this wind speed increase into a headline impact figure, asserting that economic loss potential is proportional to the cube of wind speed.
They assert that a 6% increase in peak winds implies a ~20% increase in destructive power (see Pielke 2007 for a discussion of the sensitivity of damage estimates to assumptions about wind-damage scaling exponents).
The math is straightforward. Whether the underlying 6% increase in peak wind speed trend is real and “unquestionable,” however, does not stand up to scrutiny.
The paper also includes a very useful supplementary analysis: It includes a test of whether the results of 1940-2024 hold up when restricted to the era when data from satellites was systematically available (1979–2024).
The satellite era is the period when global weather observations, and thus global reanalysis, became far more comprehensive and reliable, as described in a recent overview — The ERA5 global reanalysis from 1940 to 2022.
The supplementary analysis to Chen et al. includes information that dramatically undercuts the headline findings that were picked up and amplified by the media.
The Honest Broker is written by climate expert Roger Pielke Jr and is reader-supported. If you value what you have read here, please consider subscribing and supporting the work that goes into it.
Read the full analysis at The Honest Broker


According to the Sixth Assessment report of the scientific body of the IPCC, hurricanes/cyclones are not getting more frequent or intense world wide.
There’s no such thing as bad weather, only inadequate clothing
Or inadequate preparation.
Peak Wind Gusts: This storm reached hurricane-force speeds, with peak gusts hitting 83–84 mph at Nantucket and Montauk Point. In contrast, the prior January 23–27 storm saw non-tornadic gusts peak around 71 mph in some coastal areas, with most non-mountainous regions seeing much lower speeds.
wind speed is increasing who needs 1940 to 2025 data we’ve got january and february 2026
if this trend continues the northeast united states is doomed
haha
scientists say all bad weather is climate change while all good weather is just weather
According to the Eco-Freak Nutcases it was never suppose to ever snow again and all this Global Warming/Climate Change are probibly the same fools who believe this Fragile Earth load of Malarkey
When I got to “Michael E. Mann, the paper’s senior author…” it’s a good thing the coffee cup was on the table and I had swallowed. Could have had a nasty mess to clean up.