 The ocean “acidification” narrative that claims humans are gradually lowering pH levels in sea water with their CO2 emissions may rest on presumptions, hypotheticals, and confirmation bias — not robust, observational scientific evidence.
A paper by Wei et al. (2015) published a year ago in the Journal of Geophysical Research effectively illustrates the vacuousness of the ocean “acidification” paradigm.
In the paper, the authors assert that “model calculations” (yes, calculations from modeling) have indicated oceanic pH levels may have decreased (i.e., lowered pH = less alkaline = more “acidic”) since the 1800s by a total of about 0.1 as consequence of the rise in anthropogenic CO2 emissions. This overall pH-lowering “trend” of less than 0.1 since the industrial era began is “predicted” to “potentially threaten the existence and development of many marine calcareous organisms”. Again, it’s the 150-year -0.1 trend in pH-lowering — which the authors admit is subject to “large errors” in measurement — that threatens the oceanic biosphere according to modeled predictions. In contrast, large natural pH drops of -0.2 to -0.5 occurring on 10-year timescales do not threaten “marine calcareous organisms.” Here are the key points from the paper:
Wei et al., 2015 Ocean acidification is predicted to reduce the saturation state of carbonate minerals in seawater and potentially threaten the existence and development of many marine calcareous organisms, such as calcareous microorganisms and corals. Model calculations have indicated an overall decrease in global seawater pH of 0.1 relative to the preIndustrial era value, and a further pH reduction of 0.2–0.3 over the next century.
We here estimate the OA rates from the two long (>150 years) annually resolved pH records from the northern SCS (this study) and the northern GBR [Great Barrier Reef], and the results indicate annual rates of -0.00039 +/- 0.00025 yr and -0.00034 +/- 0.00022 yr for the northern SCS [South China Sea] and the northern GBR [Great Barrier Reef], respectively. … [T]hese two time-series do not show significant decreasing trend for pH. Despite such large errors, estimated from these rates, the seawater pH has decreased by about 0.07‚Äì0.08 U over the past 200 years in these regions. … The average calculated seawater pH over the past 159 years was 8.04 [with a] a seawater pH variation range of 7.66‚Äì8.40.
Below is the “money” graph from the paper that depicts sea surface temperature anomalies (top) and decadal-scale variations ranging between 7.66 and 8.40 in seawater pH (bottom) since the 1850s for the West Pacific Ocean:

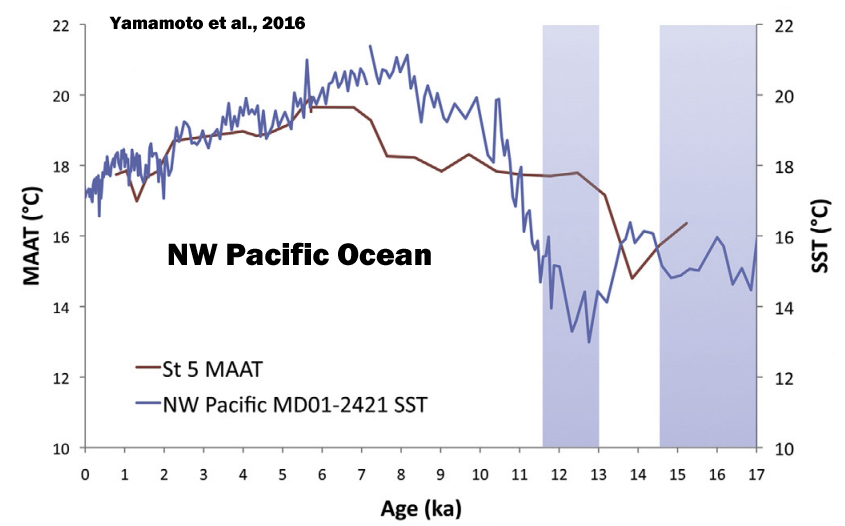
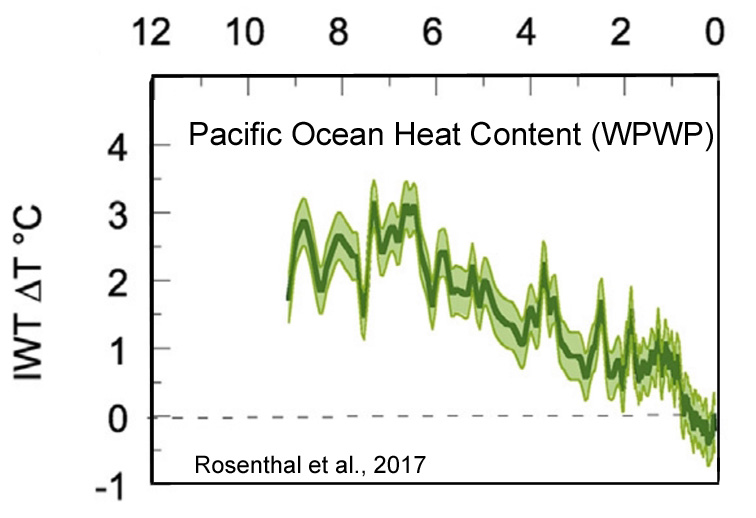
First, notice that the Wei et al. (2015) sea surface temperature (SST) graph (top, green font) indicates there has been a rather significant cooling trend in the Western Pacific since the 1980s, and that SSTs are no warmer today than they were in the 1850s. This is consistent with other reconstructions that show modern SSTs in the region (NW Pacific) may still be a full degree C colder than they were during the Medieval Warm Period, and multiple degrees colder than they were a few thousand years ago (Yamamoto et al., 2016, Rosenthal et al., 2017).


