• Privacy Policy
  • About Us
  • Contact Us
Climate Change Dispatch
  • Home
  • Videos
  • Who We Are
  • Facts Vs. Fearmongering
    • Real science vs Junk Science
      • 1100-plus Peer-Reviewed Studies
      • Michael Crichton: Aliens Cause Global Warming
      • Climate change and its causes
      • Climate Science Primer
      • CO2 is not pollution
      • Deceptive Surface Temperature Records
      • Editorial: Great Global Warming Hoax
      • Rules for Climate Radicals: Part 1
      • Rules for Climate Radicals: Part 2
      • Rules for Climate Radicals: Part 3
      • Why CO2 Is A Minor Player In Global Climate
      • Why Politicized Science Is So Dangerous
    • Facts Not Fear
      • A Simple Question For Climate Alarmists
      • Climate Change – The Facts
      • Climate Change Fears Are Empirically Baseless
      • Global Warming 101
      • Global Warming Q&A
      • Understanding The Medieval Warm Period
      • Ocean Cycles and Climate
      • Overview of Plate Climatology Theory
      • Precautionary Principle
      • Should We Celebrate Carbon Dioxide?
      • The Skeptics Handbook
      • Weather Versus Climate
      • Why I’m a GW skeptic
      • Winning the climate debate with facts
      • Why Aliens Cause Global Warming
    • Greenhouse FAQs
      • CO2, Plants, & Industry
      • How much have temps changed?
      • How much have temps changed?
      • How much have temps changed?
      • Is global warming real?
      • Measuring temperature
      • Swimming in CO2?
      • Scientists urge caution?
      • Today’s warming trend
      • Variations in temperature
    • Gore’s Greatest Goofs
      • Deconstructing the Truth
      • Fact-Checking Al Gore’s Latest Predictions
      • How Gore Created The Global Warming Hoax
    • Inside Real Climate
      • Closer look at the 97% Consensus
      • GW’s Amazing Story
      • IPCC gets failing grade
      • Real Climate Exposed!
      • Truth about Real Climate
      • We’ve Been Conned
      • What is there a 97% consensus about?
    • Behind the IPCC
      • 1,000 Scientists Dissent
      • Climategate: Caught Green-Handed!
      • Climategate Inquiries
      • Climategate Inquiries 2
      • NIPCC Report Now Available
      • Understanding the Climategate Inquiries
  • Submissions
  • Contact Us
No Result
View All Result
Climate Change Dispatch
No Result
View All Result

NOAA Calls 2025 Third-Warmest Year On Record — The Science Doesn’t Add Up

Exposing NOAA’s 2025 climate report: sloppy guesswork and missing data.

by Lynne Balzer, guest post
January 19, 2026, 10:07 AM
in Extreme Weather, News and Opinion, Politics, Science
Reading Time: 6 mins read
A A
3

temp map bouys
The 2025 annual report recently issued by the National Centers for Environmental Information, a division of NOAA, claims that 2025 was the third hottest year in recorded history. [Full report]

“NOAA ranks 2025 as the third-warmest year in its global temperature record, which dates back to 1850.”

Should we believe this? Well, not if we understand the scientific method, because whoever came up with this report doesn’t.

First of all, in science, we don’t mix apples and oranges. In 1850, there were very few weather stations taking daily temperature readings, as demonstrated by this world map.

Figure 1: Station coverage was still sparse outside Europe & North America in 1861–1890; many regions had few or no formal long-term stations until the early 20th century. Today, land-based weather stations cover less than 25% of the Earth.

Broad weather observation networks were just getting organized in the mid-19th century. Systematic weather station networks didn’t cover the globe in 1850 — very few stations existed outside major cities and observatories, and even in the U.S., the network was nascent.

Europe had scattered scientific observatories taking measurements (thermometers, barometers, etc.), but there was no standardized, coordinated global network like we have today.

Most temperature collection was done in Europe and the eastern United States. There were just a few in South America, Africa, Asia, and Australia. There was also no system for measuring the temperature of the oceans, which cover about 70% of the Earth’s surface.

So how in the world could they have come up with a valid average temperature of the Earth in 1850? This means that we have no idea how much the Earth’s temperature has risen since then.

Obviously, there was a lot of guesswork involved here. Yet these temperature increases are spelled out to the hundredths of a degree. How can that be? This is from NOAA’s website:

“The year 2025 ranked as the third-warmest year since global records began in 1850, finishing 1.17°C (2.11°F) above the 20th-century average of 13.9°C (57.0°F). This value narrowly missed the second-place currently held by 2023 (by 0.02°C / 0.04°F) and trailed the all-time record set in 2024 by 0.12°C (0.22°F).”

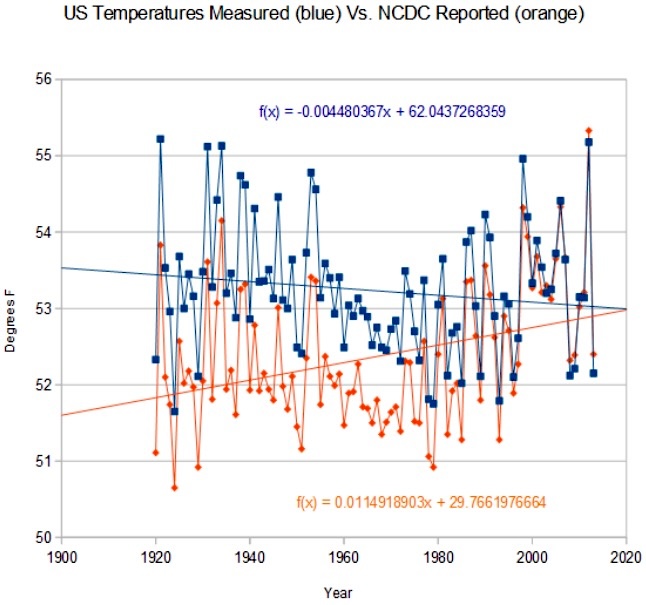
Secondly, these are surface temperatures they are talking about. Satellite temperature measurement avoids a serious problem with surface measurement: the Urban Heat Island (UHI) effect.

Thermometers used in ground-based weather stations are often located in cities as well as in airports and other paved areas, where concrete, after absorbing radiation from the sun, raises the temperature.

A century ago, most weather stations were located in grassy, unpaved, rural areas.

The influence of human activities such as traffic, concrete, and air conditioner exhaust vents could make a difference of a few degrees, skewing the results. Cities developed around weather stations that had originally been located in semi-remote areas.

A team of volunteers, headed by meteorologist Anthony Watts, checked US weather stations to identify those with such problems. When he confronted NOAA about the problems at these weather stations, they refused to fix them, countering that they were compensating for the problem by making “adjustments”.

But how would they know how much of an adjustment to make at each station? This is a sloppy measurement and certainly not science.

About three percent of the Earth’s land area is affected by the UHI effect. The average temperatures of the Earth’s great cities, such as New York, have risen significantly in the past century.

Global warming IS happening in cities. But the temperatures of most smaller cities and towns have remained flat or even dipped lower during the same time period. So NOAA can tell us that temperatures have risen, but that means nothing.

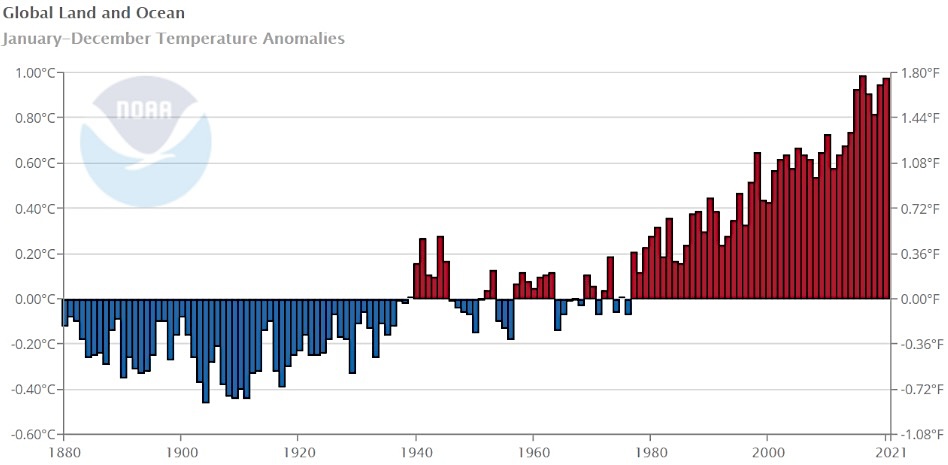
Another very serious problem with NOAA is that they’ve been caught changing recorded temperatures, lowering the older ones and raising recent ones to make it appear that it’s getting warmer.

Many climate scientists have been surprised and shocked to see later editions of graphs published by NOAA and NASA that were changed from their previous editions.

These agencies don’t deny that they’ve cooked the data. With a flurry of doublespeak, they admit that they’ve made “adjustments” to it.

In the year 2000, NASA charts showed about 0.5°C. of warming before 2000. But in 2023, the very same charts showed nearly 1.5°C of warming for the same time period.


Temperature data were also fudged by the Climate Research Unit (CRU) in Britain, Australia, and New Zealand. This blatant fraud being committed right before our eyes goes against every principle of science.

In the year 1911, a massive heat wave killed tens of thousands of people in Europe and the United States. This is verified by newspaper reports from 1911. In France alone, 41,000 people died.

In Nashua, New Hampshire, the temperature reached 106° F, and in Maine, the temperature reached 112°F. Thousands died in New England. Yet strangely, NASA’s graph shows 1911 as a cold year.

1910, 1911, and 1912 were all exceptionally hot years. Rapid melting of glaciers was reported. A collision with an iceberg that had calved off a glacier sank the Titanic on April 12, 1912, at a latitude close to that of New York City.

A May 5, 1912, article in the New York Times reads,

“An unprecedentedly warm Winter in the entire Arctic is believed to be the cause of the vast number of icebergs in the north Atlantic Ocean during the present season, and for the low latitudes which many of them have reached… Last year, according to officials at the Hydrographic Office, the thermometer reached 94 degrees in midsummer at Irigtut, on the west coast of Greenland.”

Yet, this graph by NOAA shows 1912 to be an exceptionally cold year, demonstrating the extent to which temperature records have been falsified. How is that possible?

NOAA graph shows 1912 as exceptionally cold, raising questions about temperature record falsification.

When the “U.S. Heat Waves” graph shown below is superimposed on the climate record starting in 1900, it comes out looking like the correct graph below. Notice how much more severe the heat waves were in the 1930s, the warmest decade of the 20th century.

This graph was included in the National Climate Assessment, vol. 2. The data source is not specified, nor is the meaning of the cross-hatching.
Superimposing the “U.S. Heat Waves” graph on the climate record since 1900 shows more severe heat waves in the 1930s.

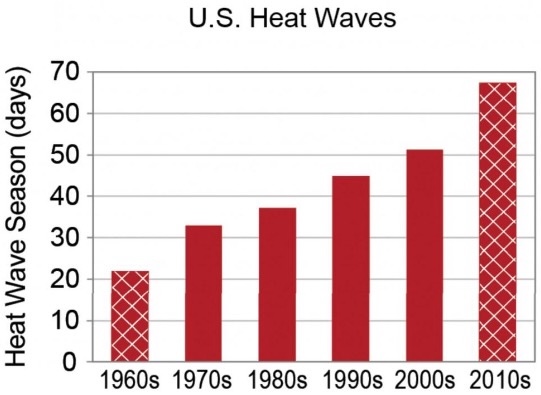
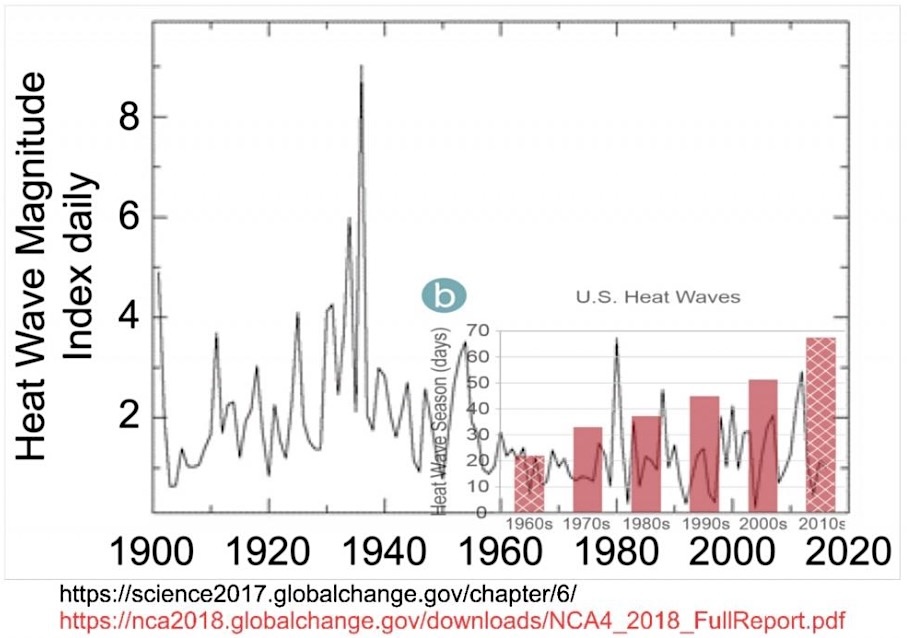
1960 was selected as the starting point for the upper graph to make it look like heat waves were getting worse, because 1960 was the coldest year. You can see how they simply wiped out the temperature history previous to 1960.

During the 1960s, the Earth was cooling while the percentage of carbon dioxide (CO2) was rising at the same time. How can that be if CO2 causes temperatures to increase?

Surface weather stations are still not evenly distributed around the globe. There are far fewer weather stations in the southern hemisphere, the polar regions, and on oceans.

Regarding the “20th-century average of 13.9°C (57.0°F),” cited in this report, there was no consistent method for measuring ocean temperatures during the entire 20th century.

The ARGO system for ocean temperature measurement wasn’t implemented until 2000. Before that, ocean temperatures were guessed at.

argo buoy
A deployed ARGO buoy.

The ocean makes up ~70% of Earth’s surface. Yet, they’re giving us these temperature increases in tenths of a degree? Come on, now.

In computing Earth’s average temperature, many temperatures in those regions are still simply guessed at. Land-based weather stations cover less than 25% of the Earth.

Thus, statements that we just had the “warmest year on record”, when the average temperature has been recorded as a few hundredths of a degree higher than the previous estimate, are meaningless.

They indicate that temperatures were flat.

Even though there were only about 1,000 weather stations used to provide data for the computer models, this number was reduced in the 1960s. Then, in the 1990s, that number was further decreased.

The main concern is which stations were retired. In Canada, a large country, most of the Arctic stations were removed, with the only one remaining in Eureka. Each station is supposed to represent a radius of 1,200 km (745 miles).

Since NOAA and NASA have demonstrated their utter disregard for careful measurement and have been repeatedly caught lying, it is utterly impossible to believe anything they say or put in print.


Hundreds of fascinating facts about the climate change scam can be found in Lynne Balzer’s richly illustrated book, “Exposing the Great Climate Change Lie”, available on Amazon. A second, expanded version of this book is due to be published on Amazon within the next month.

  • Truth
  • Twitter
  • Facebook
  • LinkedIn
  • Gettr
  • Threads
  • gab-logo Gab
  • Mastodon
  • Buffer
  • Telegram
  • Email
  • Copy Link
  • Share Using More Networks…

Popular Posts

News

Scientific Bombshell Undermines The Climate Doom Narrative

Oct 23, 2024
Electric Vehicles (EVs)

The ‘Green’ Scam Of The Century: How ‘Renewables’ Increase Fossil Fuel Demands

Oct 23, 2024
News and Opinion

Antarctica Is Colder, Icier Today Than At Any Time In 5,000 Years

Apr 15, 2024

Comments 3

  1. Richard Greene says:
    1 month ago

    I understand not wanting to accept data from NOAA or any data before 1975. The only alternative is UAH satellite data since 1979.
    UAH; 2025 was the 2nd warmest year (behind 2024) in the 47-year satellite record. 2nd warmest is not that much different than third warmest. There is no evidence that any decade in the past 10,000 years was warmer than the prior decade. I’m talking about estimates of the global average temperature based on an average of local proxies.

    This article served no purpose

    Reply
    • Steve Bunten says:
      1 month ago

      If the article serves no purpose then I’d add that your reply serves even less than none.

      Reply
    • Glen Michel says:
      1 month ago

      The article served many purposes including the highlighting of the adjustments to the temperature records. Which continues

      Reply

Comments are welcome! Those that add no discussion value may be removed.Cancel reply

Stay Connected!

gab-logo

Donate Today

Beating back the alarmist narrative takes time and money. Please donate today to help!

Get notified when new posts are published!

Subscribe to receive a digest of daily stories, or get emailed once they're published. Check your Junk/Spam folder for a verification email.

Recent Posts

  • weir cnnCNN’s Bill Weir Says It’s ‘Not Cold Enough’ To Ice Skate In Central Park – Roll Tape
    Mar 2, 2026
    Bill Weir said Central Park no longer freezes long enough for ice skating — but videos show skaters on the ice weeks before his claim. […]
  • turbines dumped‘Dark Side Of Green Energy’: Illegal Wind Blade Dumping Exposed In Sweetwater, Texas
    Mar 2, 2026
    Texas officials filed civil and criminal charges after thousands of wind turbine blades were allegedly dumped near Sweetwater. […]
  • lng terminal dockPipeline Bottlenecks And Bad Policy Drive Up Natural Gas Prices — Not LNG Exports
    Mar 2, 2026
    LNG exports aren’t behind high U.S. natural gas prices; pipeline bottlenecks and state policy failures are driving regional price spikes. […]
  • earth dot com alarmist headline‘Deadly Fungus’ Spreading? Climate Scare Story Falls Apart Under Scientific Scrutiny
    Mar 2, 2026
    Climate model projections — not real-world data — drive claims that a “deadly fungus” is rapidly spreading worldwide. […]
  • exxon signExxon Fights Back, Sues California AG Rob Bonta For Defamation
    Feb 27, 2026
    Exxon sues California AG Rob Bonta for defamation, marking a rare moment of Big Oil going on offense in climate lawfare battles. […]
  • laurene jobsLeftist Billionaire Laurene Powell Jobs Backing Star-Studded Climate Doom Movie
    Feb 27, 2026
    Laurene Powell Jobs backs a Hollywood adaptation of Losing Earth, bringing A-list actors into a 'darkly comic' climate doom movie. […]
  • oil rig drillU.S. Oil And Natural Gas Output Hit Record Highs In Trump’s First Year Back
    Feb 27, 2026
    Record oil and gas output and falling gas prices mark a sharp U.S. energy shift after one year of policy reversal. […]
  • eu storms not newData Show Media Wrong On Climate Change Worsening European Flooding, Winter Storms
    Feb 27, 2026
    Data and IPCC findings show no clear upward trend in European flooding or winter storms despite media climate claims. […]
  • rooftop solar installerSunnova’s Continuing Mess Signals Wider Rooftop Solar Trouble – Part 2
    Feb 26, 2026
    Sunnova’s collapse after a terminated DOE loan guarantee leaves unfinished installs, debt disputes, and a stark warning: buyer beware. […]
  • trump speechSenate Passes Nuclear Energy Reform As GOP Targets Biden-Era Appliance Regs
    Feb 26, 2026
    Senate passes nuclear reform 88-2 while GOP moves to repeal Biden-era appliance rules in a broader push to cut energy and housing costs. […]

Submit a tip

Please enter your email, so we know you're human.

Books You May Like

Climate prn book

exposing great lie

Have a suggestion? Let us know! We swap out books based on your input. We participate in the Amazon Services LLC Associates Program. See here.

  • Privacy Policy
  • DMCA Policy
  • About Us
  • Contact Us

© Portions copyright Climate Change Dispatch

No Result
View All Result
  • Home
  • Videos
  • Who We Are
  • Facts Vs. Fearmongering
    • Real science vs Junk Science
      • 1100-plus Peer-Reviewed Studies
      • Michael Crichton: Aliens Cause Global Warming
      • Climate change and its causes
      • Climate Science Primer
      • CO2 is not pollution
      • Deceptive Surface Temperature Records
      • Editorial: Great Global Warming Hoax
      • Rules for Climate Radicals: Part 1
      • Rules for Climate Radicals: Part 2
      • Rules for Climate Radicals: Part 3
      • Why CO2 Is A Minor Player In Global Climate
      • Why Politicized Science Is So Dangerous
    • Facts Not Fear
      • A Simple Question For Climate Alarmists
      • Climate Change – The Facts
      • Climate Change Fears Are Empirically Baseless
      • Global Warming 101
      • Global Warming Q&A
      • Understanding The Medieval Warm Period
      • Ocean Cycles and Climate
      • Overview of Plate Climatology Theory
      • Precautionary Principle
      • Should We Celebrate Carbon Dioxide?
      • The Skeptics Handbook
      • Weather Versus Climate
      • Why I’m a GW skeptic
      • Winning the climate debate with facts
      • Why Aliens Cause Global Warming
    • Greenhouse FAQs
      • CO2, Plants, & Industry
      • How much have temps changed?
      • How much have temps changed?
      • How much have temps changed?
      • Is global warming real?
      • Measuring temperature
      • Swimming in CO2?
      • Scientists urge caution?
      • Today’s warming trend
      • Variations in temperature
    • Gore’s Greatest Goofs
      • Deconstructing the Truth
      • Fact-Checking Al Gore’s Latest Predictions
      • How Gore Created The Global Warming Hoax
    • Inside Real Climate
      • Closer look at the 97% Consensus
      • GW’s Amazing Story
      • IPCC gets failing grade
      • Real Climate Exposed!
      • Truth about Real Climate
      • We’ve Been Conned
      • What is there a 97% consensus about?
    • Behind the IPCC
      • 1,000 Scientists Dissent
      • Climategate: Caught Green-Handed!
      • Climategate Inquiries
      • Climategate Inquiries 2
      • NIPCC Report Now Available
      • Understanding the Climategate Inquiries
  • Submissions
  • Contact Us

© 2026 Climate Change Dispatch

 
Share via
  • Facebook
  • Like
  • Twitter
  • Pinterest
  • LinkedIn
  • Digg
  • Tumblr
  • VKontakte
  • Print
  • Email
  • Reddit
  • Buffer
  • Love This
  • Weibo
  • Pocket
  • Xing
  • Odnoklassniki
  • WhatsApp
  • Meneame
  • Blogger
  • Amazon
  • Yahoo Mail
  • Gmail
  • AOL
  • Newsvine
  • HackerNews
  • Evernote
  • MySpace
  • Mail.ru
  • Viadeo
  • Line
  • Flipboard
  • Comments
  • SMS
  • Viber
  • Telegram
  • Subscribe
  • Facebook Messenger
  • Kakao
  • LiveJournal
  • Yammer
  • Edgar
  • Fintel
  • Mix
  • Instapaper
  • Copy Link
  • Truth
  • gab-logo Gab
  • Gettr
  • Baidu
  • Mastodon
  • Threads
  • Bluesky
Share via
  • Digg
  • Tumblr
  • VKontakte
  • Print
  • Email
  • Reddit
  • Buffer
  • Love This
  • Weibo
  • Pocket
  • Xing
  • Odnoklassniki
  • WhatsApp
  • Meneame
  • Blogger
  • Amazon
  • Yahoo Mail
  • Gmail
  • AOL
  • Newsvine
  • HackerNews
  • Evernote
  • MySpace
  • Mail.ru
  • Viadeo
  • Line
  • Flipboard
  • Comments
  • SMS
  • Viber
  • Telegram
  • Subscribe
  • Facebook Messenger
  • Kakao
  • LiveJournal
  • Yammer
  • Edgar
  • Fintel
  • Mix
  • Instapaper
  • Copy Link
  • Truth
  • gab-logo Gab
  • Gettr
  • Baidu
  • Mastodon
  • Threads
  • Bluesky