Recent research shows that the volume of volcanic CO2 currently being emitted into Earth’s atmosphere is far greater than previously calculated, challenging the validity of the man-made global warming theory.

The cornerstone principle of the global warming theory, anthropogenic global warming (AGW), is built on the premise that significant increases of modern era human-induced CO2 emissions have acted to unnaturally warm Earth’s atmosphere.
A warmed atmosphere that directly, or in some cases indirectly fuels anomalous environmental disasters such as ocean warming, alteration of ocean chemistry, polar ice sheet melting, global sea level rise, coral bleaching and most importantly dramatic changes in climate.
There are numerous major problems with the AGW principle.
Identification of Volcanic vs. Man-made CO2
Natural volcanic and man-made CO2 emissions have the exact same and very distinctive carbon isotopic fingerprint.
It is therefore scientifically impossible to distinguish the difference between volcanic CO2 and human-induced CO2 from the burning of fossil fuels (see here).
This major problem with the AGW principle has been rationalized away by consensus climate scientists who insist, based supposedly reliable research, that volcanic emissions are minuscule in comparison to human-induced CO2 emissions (Gerlach 1991).
Terrance Gerlach’s volcanic CO2 calculation was based on just 7 actively erupting land volcanoes and three actively erupting ocean floor hydrothermal vents (seafloor hot geysers).
Utilizing gas emission data from this very limited number of volcanic features, Gerlach estimated that the volume of natural volcanic CO2 emissions is 100 to 150 times less than the volume of man-made CO2 emissions from the burning of fossil fuels and therefore of no consequence.
To put this calculation process into perspective, the Earth is home to 1,500 land volcanoes and 900,000 seafloor volcanoes/hydrothermal vents.
By sampling just an extremely small percent of these volcanic features it is impossible to imagine that the calculation is correct.
Especially knowing that volcanic activity varies greatly from area to area, volcano to volcano, and through time. Utilizing just 0.001 percent (10/901,500) of Earth’s volcanic features to calculate volcanic CO2 emissions does not inspire confidence in the resulting value.
Non-Erupting Volcanoes Can Emit Massive Amounts of CO2 into Earth’s Atmosphere
Recent geological research by the University of Leeds and others proves that non-erupting volcanoes can emit massive amounts of CO2 into Earth’s atmosphere and oceans. The Gerlach calculation and all follow-up calculations utilized volcanic CO2 rates from actively erupting volcanoes.
Lost in the numerous recent media articles concerning the argument of when, or if Iceland’s Katla Volcano will erupt is the discovery that this non-erupting subglacial volcano is currently emitting staggering amounts of CO2 into Earth’s atmosphere!
Researchers from the University of Leeds who studied the Katla Volcano said this.
“We discovered that Katla volcano in Iceland is a globally important source of atmospheric carbon dioxide (CO2) in spite of being previously assumed to be a minor gas emitter. Volcanoes are a key natural source of atmospheric CO2 but estimates of the total global amount of CO2 that volcanoes emit are based on only a small number of active volcanoes. Very few volcanoes which are covered by glacial ice have been measured for gas emissions, probably because they tend to be difficult to access and often do not have obvious degassing vents. Through high‐precision airborne measurements and atmospheric dispersion modeling, we show that Katla, a highly hazardous subglacial volcano which last erupted 100 years ago, is one of the largest volcanic sources of CO2 on Earth, releasing up to 5% of total global volcanic emissions. This is significant in the context of a growing awareness that natural CO2 sources have to be more accurately quantified in climate assessments and we recommend urgent investigations of other subglacial volcanoes worldwide.”(see here)
The Number of Volcanoes Emitting CO2 into the Atmosphere at Any One Time
The calculation of the total yearly volume of volcanic CO2 emitted into the atmosphere is based on the presumption that very few volcanoes are erupting at any one time.
Scientists from various worldwide volcano research institutions, most notably the United States Geological Survey, have estimated this number to be 20.
This very low number has been challenged by many scientists including those at NASA.
A multinational team led by NASA has initiated a high-resolution satellite CO2 monitoring project (see here). This project is focused on determining how many geological features are emitting CO2 at any one time.
This project may eventually give scientists a better idea of how many land volcanoes are emitting CO2 at any one time.
However, it is doubtful the project will properly record ocean CO2 emissions from Earth’s 900,000 deep ocean floor and very difficult to monitor volcanic features.
In any case, this project is certainly a step forward towards achieving a better understanding of the climate influence of volcanic CO2 emissions.
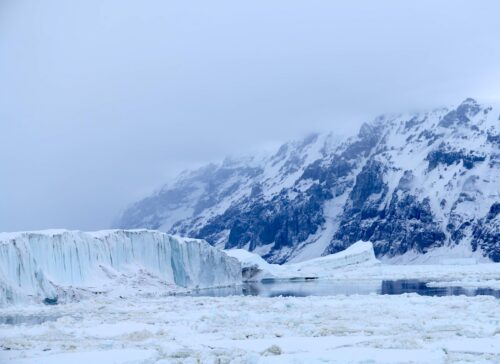
The Amount of CO2 and heat infused into Earth’s Oceans by Seafloor Geological Features
About 71% of Earth’s surface is covered by oceans making it a water, not land, planet. For many years now, scientists have contended that the nearly one million geological features present in these vast ocean regions have played a minimal role in heating and chemically charging ocean seawater.
Instead of contending that man-made atmospheric CO2 was the root cause of changes to our oceans.

Recent research has proven that the contentions of these scientists are far from 100% proven. To the contrary, it has become clear that geological heat flow and chemically charged heated fluid flow into our oceans is far more influential than previously thought and possibly the root cause of changes to our oceans.
One example is that geological features are warming Earth’s oceans and causing El Nino’s and La Nina’s (see here, here, and here). Warmed seawater is not capable of holding as much CO2 as cold water.
So, the geologically warming of seawater indirectly leads to a large amount of CO2 being released from oceans and emitted into the atmosphere.
Recent research shows that seafloor geological features also directly emit large amounts of CO2 into our oceans and atmosphere(see here, here, here, and Figure 2).
In summary, the volume of volcanic CO2 being emitted into the Earth’s atmosphere has not been accurately assessed.
Numerous research studies and articles conducted/written by qualified scientists concur with this contention (see here, here, and here).
In a geological time frame, Earth has gone through many periods of increased volcanism. These volcanic periods resulted in; major plant and animal extinction events (see here, here, and here), the end of glacial eras (see here) and the dramatic alteration of Earth’s climate (see here).
All indications are that Earth is currently experiencing another period of strong volcanic activity which is acting to infuse CO2 into our atmosphere thereby challenging the validity of the global warming theory.
Clearly, its time to put on hold all environmental action plans based on the cornerstone AGW principle of the global warming theory until additional geological CO2 emission research is conducted.
James Edward Kamis is a retired professional Geologist with 42 years of experience, a B.S. in Geology from Northern Illinois University (1973), an M.S. in geology from Idaho State University (1977), and a longtime member of AAPG who has always been fascinated by the connection between Geology and Climate. More than 14 years of research/observation have convinced him that the Earth’s Heat Flow Engine, which drives the outer crustal plates, is an important driver of the Earth’s climate as per his Plate Climatology Theory.
Please consider a DONATION To Help Us With Server And Hosting Costs.


The Lake Nyos disaster revealed that volcanic vents can be very high in CO2. Other African seeps are similarly high in CO2. My calculations show that global CO2 emissions are an order or two of magnitude higher than assumed by AGW advocates.
Turns out Jack, that the matrix was not able to resolve things so they were reduced to using terms such as “Likely caused by AGW” in the SPWs and the layer below. The real scientific evidence did not ever support even that. These terms are prime evidence that their claims are wrong, because misusing the appropriate words would remove all doubt of your beliefs’ falsehood. Real research, not modelling which can never produce real data, shows that the growing ‘Quiet Sun’ effect is cooling the world’s surface. This effect is part of Orbital Mechanics like the normal c.63yr full warm/cold cycle most noticeable to our way of life and mortal spans. AGW breaches the Gas Laws and Thermodnamics, also atmospheric physics because buoyancy and latent heat transfer shift the energy ahead of radiation, a weaker force.
Mr. Dale, I choose the Skeptical Science link specifically because it is from an AGW advocate who debunks himself in his article….”Declining C14 ratio indicates the source is very old, hence fossil fuel or volcanic (ie, not oceanic outgassing or a recent biological source)”. I found this fascinating that he would of his own choice state that the isotopic fingerprint of volcanic CO2 and human induced CO2 from burning of fossil fuels are identical. There other references to this isotopic CO2 fingerprinting, but this particular one seemed so ironic.
Jim
You needed to read deeper.
Declining C14 ratio indicates the source is very old, hence fossil fuel or volcanic (ie, not oceanic outgassing or a recent biological source);
Declining C13 ratio indicates a biological source, hence not volcanic;
Declining O2 concentration indicate combustion, hence not volcanic;
I would also suggest that you read:
http://www.jamespowell.org/Stuff/Ourfault/Ourfault.html
Dr, Powell is a geologist. http://www.jamespowell.org/Bio/bio.html
The conclusion from SKS
As a child I enjoyed playing Cluedo (Clue in the US market). I soon learned you discovered more from the questions people did not respond to than from those that they did, and developed a matrix from which to plot responses and non-responses. Filling in the matrix soon honed in on the correct answer, who killed whom, with what and where. Science is sometimes like that. The lines of evidence are the questions we put, and if we plot out our matrix, it quickly becomes clear that it is the humans who have caused the rise in CO2 levels, by burning fossil fuels in the twentieth century. Every other hypothesis makes a host of predictions that do not pass the test of the evidence.
https://skepticalscience.com/pics/matrix_CO2_2.jpg
To support his contention, the author links to Skeptical Science which says the exact opposite.
But, but climate “activates” say volcanoes contribute nothing to the CO2 in the atmosphere.
Looking at the past 110 years including all other man made drivers of CO2.
In 1900 there were only about 8,000 cars in the United States and possibly not more than 25,000 worldwide. It was estimated in 2010 that the number of cars had risen to over 1 billion vehicles. A 3030302930% increase of automobiles over 110 years.
World population in 1900 was 1,650,000,000. World population in 2010 was 6,930,000,000. A 320% of worldwide population over 110 years.
Add in massive deforestation for crops and huge herds of sheep, goats, pigs, cows and chickens and….. over 110 years.
Plus… a huge increase in electrical demand over the same 110 years. How much additional CO2 was produced there over 110 years?
Well, if we generously round up all man caused CO2 we could say it increased by some 3030303030% over the same 110 years. Maybe even higher??
With a 3030303030% increase in man caused CO2 levels over 110 years one would expect current CO2 levels to be much much higher. After all, a 3030303030% increase is a lot! No?
No. Considering all other NATURAL sources, man’s contribution to atmospheric CO2 levels is statistically insignificant. See, https://climatechangedispatch.com/massive-volcano-emissions-warming/
But there is a problem with those pesky CO2 levels.
Like, where is this CO2 data collected? And what do those CO2 reading really reflect??
In 1958, Charles David Keeling began making daily measurements of the concentration of atmospheric carbon dioxide (CO2) at the Mauna Loa Observatory on the Big Island of Hawaii. (Mauna Loa, the largest ACTIVE subaerial volcano in both mass and volume)
Why there? The Mauna Loa Observatory is isolated in the middle of the Pacific Ocean and at over 11,000 feet above sea level, the upper NORTH face of Mauna Loa VOLCANO is an IDEAL LOCATION to make measurements of atmospheric carbon dioxide that reflect global trends, not local influences such as factories or forests that might boost or drop carbon dioxide within their vicinity. The CO2 sensors at Mauna Loa are positioned such that they sample an incoming breeze direct from the ocean, unaffected by human activities, vegetation or other factors on the island. The Mauna Loa Observatory is high enough that the incoming breeze, Trade winds, blow from a NE to ENE direction and ride above the thermal inversion layer.
But aren’t volcanoes considerable sources of carbon dioxide themselves. Yes they are. However, the sampling location Keeling chose was to be NORMALLY upwind of Mauna Loa’s vent, and Keeling perfected methods for detecting and correcting intervals when the wind blew the wrong way. Contamination from local volcanic sources is sometimes detected at the observatory, and is then removed from the background data.
BUT. Because they were formed by volcanic activity, the Hawaiian islands are no stranger to eruptions. Mauna Loa and Mauna Kea (dormant) are two huge volcanoes on the Big Island. And there are 5 KNOWN active volcanoes in Hawaii: Lo’ihi, Kilauea, Mauna Loa, Hualalai and Haleakala. Lo’ihi is an underwater volcano; the other four volcanoes are above sea level. There are also UNEXPLORED underwater volcanoes off the coast of Hawaii.
Looking at the historic CO2 levels recorded at Mauna Loa we see the vast majority of the CO2 increase recorded occurred from 1980 through 2018.
The “Problem”. Remember Kilauea?? http://bigislandnow.com/lavamap/
Kilauea, the shield-type volcano on the Big Island of Hawaii, which has been erupting continuously, with increasing activity ever since 1983. Kilauea, one of at least 5 ACTIVE volcanoes in Hawaii, just happens to be located N and E of the Mauna Loa Observatory. UP WIND from the Mauna Loa observatory….OOOPS!
Perhaps you could inform us when Keelings instrumentation and methods were last subject to independant verification and validation in view of the time period since his record production began?
NOAA Validates itself.
https://scripps.ucsd.edu/programs/keelingcurve/2018/06/07/another-climate-milestone-falls-at-mauna-loa-observatory/
Air samples are also shipped to NOAA’s Earth System Research Laboratory in Boulder, Colo. for verification, as well as further analysis.
The two research entities make redundant measurements at Mauna Loa as a means of quality control and to ensure the continuity of the record should one system or the other be unable to record data. Though Kilauea volcano is 20 miles away from the observatory, influences from volcanic gases are also slight and screened out before daily readings are recorded.
But they do have other site data for comparison.
https://www.esrl.noaa.gov/gmd/dv/data/?category=Greenhouse%2BGases
Check it out. Explore this sites CO2 data bases. Let me know if notice anything peculiar.
Mauna Loa is not the only CO2 monitoring station. Barrow, Alaska (no volcanoes) and Cape Grimm, Tasmania (no volcanoes) get similar results to Mauna Loa.
And where does the reading of atmospheric CO2 come from? None other than Mauna Loa, a non erupting volcano in Hawaii. I always thought that was a ridiculous location for measuring CO2. Surely to get a reasonably accurate figure, measurements should be taken at many locations around the world and averaged, and miles away from any volcanos.
In 1958, Charles David Keeling began making daily measurements of the concentration of atmospheric carbon dioxide (CO2) at the Mauna Loa Observatory on the Big Island of Hawaii. (Mauna Loa, the largest ACTIVE subaerial volcano in both mass and volume) Mauna Loa is among Earth’s most active volcanoes, having erupted 33 times since its first well-documented historical eruption in 1843.
Mauna Loa is not the only CO2 monitoring station. The others get similar results.
Keeling is a very cautions scientist and his methodology is based on screening out any local emissions.
I’ve been pointing out those liquid CO2 smokers for a long time. I’m glad someone else is pointing them out now. It would be interesting to know how much the liquid CO2 converts to.
As the contents of the Earth are released into the atmosphere as gases, gravity compresses that increased mass and surface temperature increases.
Idiot , the mass doesn’t increase , It just moves from the strata , to the atmosphere…
I really would like to see Bloomberg survive on Social Security…..
Maybe Professor Mann would like to use
Steyer and Bloomberg’s money to develop
a technology to deactivate and seal volcanoes.
Especially the underwater ones.
They have the tech to split the co2 molecule using passive collectors, why don’t they do that