Geological heat flow is fueling bottom melting and associated cracks across West Antarctica’s Larsen Ice Shelf, having little to do with man-made global warming.
Significant amounts of high-quality data and relevant geological observations support this revelation, given historical and current geological mapping efforts done in Antarctica.
The extremely harsh surface weather conditions and thick ice cover of Antarctica have up until just recently greatly inhibited research, exploration, and proper mapping of the continent’s underlying geology. As a result, the geographic position of active regional geological trends and individual geological features was only partially defined.
However, this is no longer true because during the last 5 to 7 years numerous research groups have braved Antarctica’s conditions and employed new state-of-the-art equipment to accurately map a significant portion of Antarctica’s geology.
These efforts have clearly shown that Antarctica, especially West Antarctica, is a very geologically active continent. It is home to massive, deep-earth, constantly shifting fault zones, numerous semi-active and active volcanoes, and a wide variety of active heat-flowing geological features.
These features are—in varying magnitudes—all emitting heat and chemically charged heated fluid into the overlying ice sheets, oceans, and atmosphere of Antarctica.
Inexplicably the media, politicians, and many scientists have not yet appreciated the strong climatic influence of these newly mapped and active heat-flowing geological features.
Instead, they have continued to insist that man-made atmospheric global warming is the sole driver of many anomalous Antarctic climate and climate-related events.
A case in point is the ongoing rift in West Antarctica’s Larsen Shelf Area “C” ice segment. This event has, as expected, spawned an absolute deluge of Pro-global warming articles.
Those written by major media outlets typically include close-up photos of cracks forming on the surface of the Larsen “C” ice segment, a sprinkling of precise data concerning the timing of melting/breakup, and plenty of time-tested global warming alarmist phrases.
Articles written by respected researchers take a more measured approach, citing only what they consider to be relevant data such as high melt rates, rapid sea ice breakup, and voluminous sea ice melting.
Still, they reach the same conclusion as the media, that the bottom melting and subsequent break up of the Larsen “C” segment is an unnatural, man-made environmental disaster.
Taken at face value these media and research articles seem quite convincing, however, they make one critical error and as a result, get it wrong: They exclude geologically induced heat flow, the most obvious and dominant influence.
Time to correct this oversight.
Regional/Continent-Wide Antarctic Geology
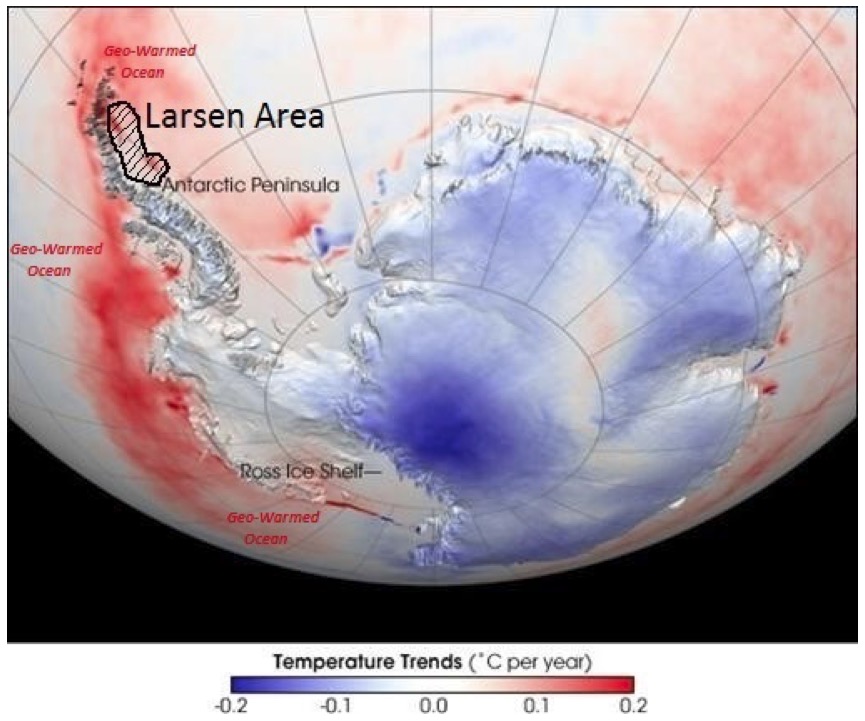
The National Oceanic and Atmospheric Administration (NOAA) “Skin Temperature Map” (Figure 1) portrays the continent-wide 23-year-averaged temperatures (1981-2004) from the top few millimeters of Antarctica’s land and sea surfaces (Figure 1).
It is important to note that the Skin Temperature Map readings do not include air temperatures, just thermal emissions (radiant heat) of Earth’s surfaces. Data for this map were collected by very sophisticated and accurate sensors carried on board the NOAA satellites, so-called Advanced Very High-Resolution Radiometer instruments.
This map is a reliable and accurate portrayal of Antarctica’s surface temperatures during the time Larsen Shelf Area sea ice was experiencing bottom melting.
The map illustrates several striking—and as it turns out very telling—differences in surface temperatures across Antarctica. First, the bright red anomalously warm colors of West Antarctica stand out in striking contrast to the bright blue anomalously colder colors of East Antarctica.
This is certainly not a trend that would be expected if a global, uniformly warming atmosphere was influencing the entire Antarctic continent. On the contrary, it strongly suggests that some other non-uniform force is selectively warming large swaths of West Antarctica.
Delving into more subtle trends on the Skin Temperature Map, it becomes clear that West Antarctica’s oceans and ice-covered ocean areas are significantly warmer (bright red shading) than corresponding East Antarctica’s oceans and ice-covered oceans (light red to white).
Lastly, West Antarctica’s landmasses are significantly warmer (white shading) than East Antarctica’s landmasses (dark blue shading). NOAA scientists agree with this overall map analysis as exemplified by the following quote. “While a warming trend is absent throughout most of Antarctica, the Antarctica Peninsula has shown warming.”
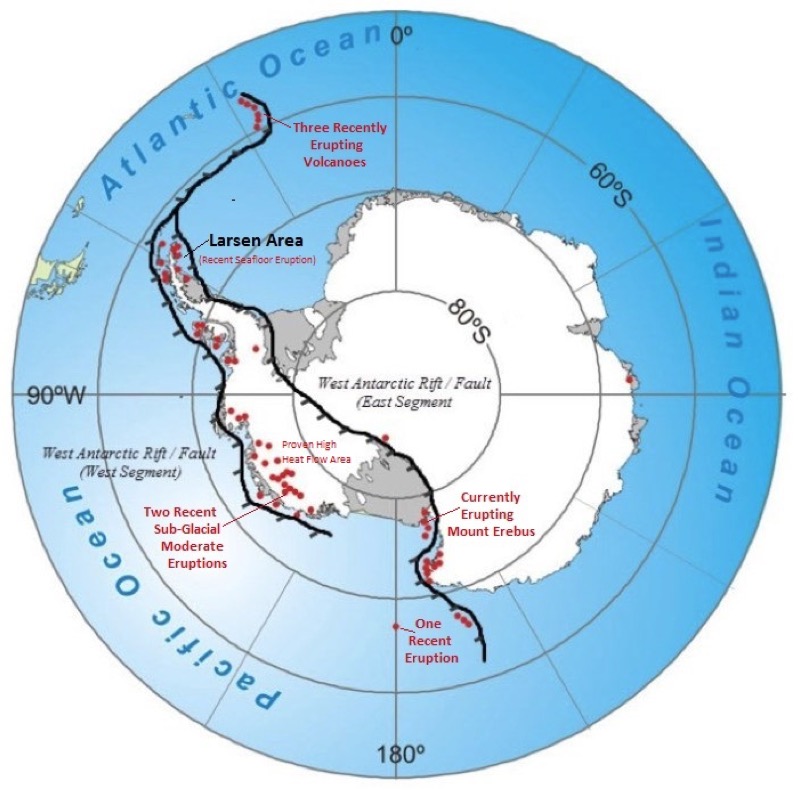
What force or forces could be causing all these surface temperature differences? Based on the available geological information, heat, and heated fluid flow are being generated from the very active West Antarctic Rift, which is Antarctica’s largest and most active fault zone (Figure 2).
This 3,500-mile-long fault forms the actively moving boundary between two giant pieces of Earth’s outer crust, West and East Antarctica.
Movement along this fault zone is ripping Antarctica apart, allowing deep-earth lava and hot fluids to erupt upward along open fault-induced fractures. Moving an entire continent requires a staggering amount of energy.
Keep in mind the giant West Antarctic Rift extends north and south into the surrounding oceans, only partially explored/mapped, and most importantly its heat flow emissions are not monitored.
Geologically induced heat flow from the West Antarctic Rift and its associated 61 active/semi-active volcanoes and the numerous, active, individual fault segments have been the focus of many previous Climate Change Dispatch articles.
For more detailed discussions of how the West Antarctic Rift has acted to bottom melt many West Antarctic Glaciers (see here, here, and here) and Addendum 1 attached to the bottom of this article.
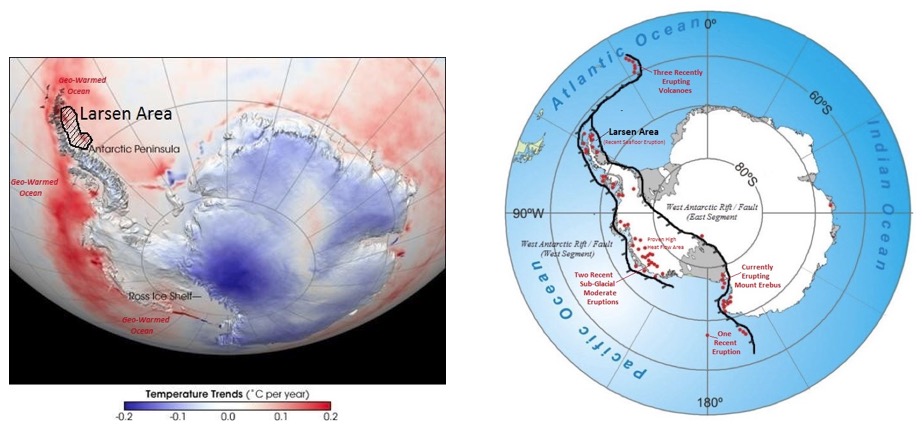
Next, let’s compare the NOAA Skin Temperature Map with the geological map of the West Antarctic Rift (Figure 3). It immediately becomes clear that these two maps mimic each other.
Most importantly the position and extent of the bright red shaded high surface temperature anomaly in West Antarctica on the NOAA Skin Temperature Map perfectly fits the outline of the West Antarctica Rift.
This is very strong proof that a cause-and-effect relationship exists. In other words, heat flow from the Rift is warming surfaces of West Antarctica lying directly above or near the Rift. This includes Rift-associated seafloor volcanoes and hydrothermal vents (deep ocean seafloor hot geysers).
Larsen “A” and “B” Break-Up (1986-1992)
The Larsen Shelf is a small portion of the West Antarctic Rift System. Larsen Shelf owes its very existence to a mixture of geologically fault uplifted land masses and volcanic eruptions that have spewed massive amounts of lava on the seafloor which progressively accumulated one on top of the other eventually forming emergent volcanic plateaus.
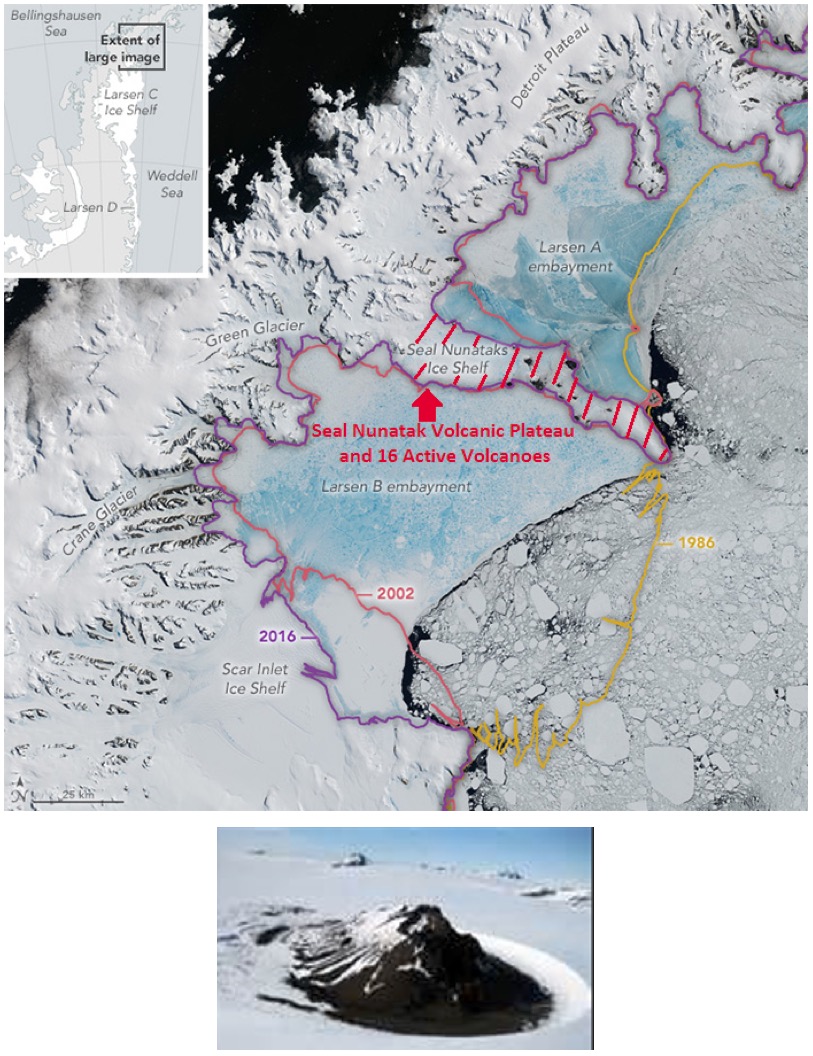
One such volcanic plateau is the Seal Nunatak Island Chain (Figure 3) which forms the boundary between the Larsen “A” and Larsen “B” sea ice segments.
This 50-mile-long and 10-mile-wide chain of visible land volcanoes and seafloor hydrothermal vents (sea floor hot geysers) has been volcanically active during the previous 125 years based on a combination of very recent research and limited amounts of early explorer observations.
Each time humans have visited the Seal Nunatak area they have recorded obvious signs of heat and heated fluid flow in the form of fresh lava flows on Nunatak volcanoes, volcanic ash on new snow, and volcanic debris within or on the relatively new glacial ice.
Keep in mind these early observations only documented volcanic activity on exposed land surfaces and not the associated volcanic activity that occurred on the seafloor of this huge volcanic platform.
In 2004 research by the National Science Foundation and others made a major discovery in the Seal Nunatak area. Using sonar, they confirmed the presence of an active seafloor volcano in deep ocean waters surrounding the Larsen Volcanic Plateau (see here and quote below).
This very significant discovery strongly supports the idea that geologically induced heated fluid is actively warming the ocean in the Larsen Area.
“Scientists working in the stormy and inhospitable waters off the Antarctic Peninsula have found what they believe is an active and previously unknown volcano on the sea bottom…Evidence of the volcano came as an unintended bonus from a research plan to investigate why a massive ice sheet, known as the Larsen B, collapsed and broke up several years ago. Scientists hope to understand whether such a collapse is unique or part of a cycle that extends over hundreds of thousands of years. Scientific evidence the team collected also corroborates mariners’ reports of discolored water in the area, which is consistent with an active volcano.” (credit NSF).
Other significant research published in 2014 by Newcastle University indicates that the Larsen “B” portion of the greater Larsen Ice Shelf pulsed a massive amount of heat in 2002. Newcastle elevation instruments showed that a huge portion of the Larsen “B” area rapidly rose vertically in a brief time frame.
During the same time frame, the overlying ice melted. This uplift is likely the result of the upward intrusion of deep-earth, hot molten lava into shallower, near-surface bedrock layers. This intrusion process acted to uplift and heat the Larsen “B” area. Radiant heat from the new uplift acted to ‘bottom melt’ the overlying glaciers.
Newcastle researchers interpreted their results differently. They posited that a very localized atmospheric warming event somehow melted just the Larsen “B” ice area and no other surrounding areas. This process then released the overlying weight of the ice allowing deep-earth magma chambers in the Larsen “B” area and only the Larsen “B” area to pop up. (see quote below).
This is an overly complex and “force fit” solution to what is here likely to be a normal geological phenomenon along a well-known, actively erupting fault zone area.
“Scientists led by Newcastle University in the UK studied the impact of the collapse of the giant Larsen B ice shelf in 2002, using Global Positioning System (GPS) stations to gauge how the Earth’s mantle responded to the relatively sudden loss of billions of tonnes of ice as glaciers accelerated. As expected, the bedrock rose without the weight but at a pace – as much as 5 centimeters a year in places – that was about five times the rate that could be attributed to the loss of ice mass alone”, said Matt King, now at the University of Tasmania (UTAS), who oversaw the work. “It’s like the earth in 2002 was prodded by a stick, a very big stick, and we’ve been able to watch how it responded,” Professor King said. “We see the earth as being tremendously dynamic and always changing, responding to the forces.” Such dynamism – involving rocks hundreds of kilometers below the surface moving “like honey” – could have implications for volcanoes in the region. Professor King said. (see here)
Two other interesting aspects of the Seal Nunatak Volcanic Plateau involve the land and sub-sea volcanoes.
Upon detailed review of the island volcano photo in Figure 4, it becomes apparent that the pictured volcanic cone is barren of ice and snow. This is a good indicator that significant geologically induced heat flow is melting the snow and ice.
Many other photos of individual Seal Nunatak Islands show the same thing. Concerning seafloor volcanoes, there has been only limited reconnaissance by deep-diving robotic instruments to test for heated fluid flow.
As mentioned above, this limited exploration has proven the existence of one seafloor volcano, however, likely and numerous other subsea volcanoes, open bedrock fractures, and hydrothermal vents will be discovered in the future.
In summary, the vast Seal Nunatak Volcanic Plateau has pulsed significant amounts of geologically induced heat and heated fluid flow into the Larsen Shelf Area oceans and landmasses during the following years: 1893, 1968, 1982, 1985, 1988, 2002, 2004, and 2010.
Knowing that this remote part of West Antarctica is virtually unmonitored and rarely visited, it is very likely that additional periods of heat and heated fluid flow have occurred in other years.
All of this is a strong indication that bottom melting and the rapid progressive breakup of the Larsen “A” and “B” ice segments are related to geological heat and heated fluid flow from a combination of regional and local geological features.
Larsen “C” Break-Up (2015-Present)
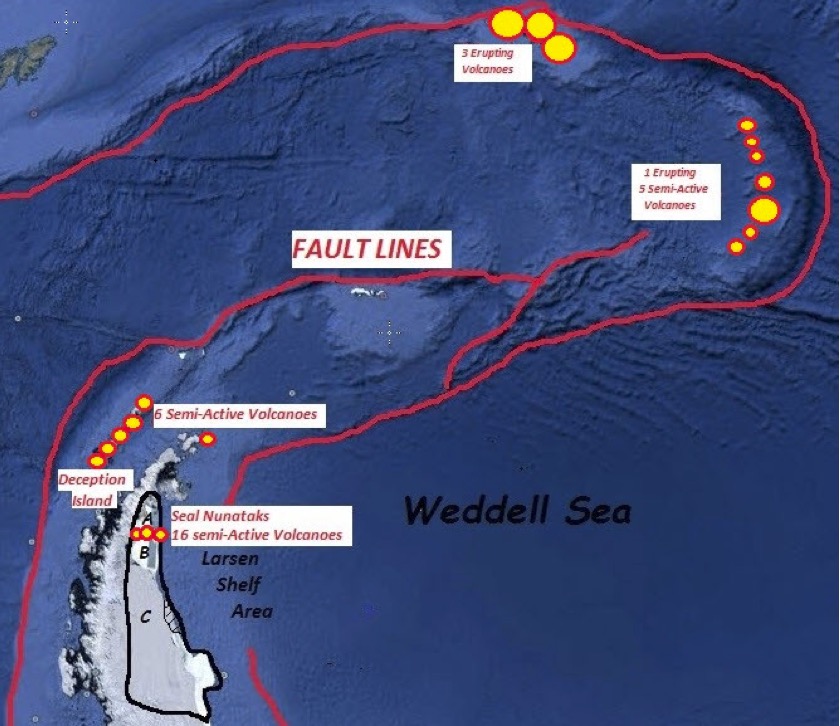
Now let’s turn our attention to the geology of the ongoing and widely published break-up of the Larsen Ice Shelf “C” segment (Figure 5). This event has caused an absolute deluge of apoplectic global warming rhetoric.
It is being billed by advocates of global warming, including those in the media and politicians, as proof positive man-made warming is melting Antarctic glaciers. However, not all scientists agree.
Several noted glaciologists have been quoted as saying, “This is a natural melting/breakup event and it’s what Antarctica does”.
Others were more specific and cited naturally occurring ocean warming as the cause of partial Larsen “C” melting. Still, others have pointed out that this breakup is occurring in the dead of Antarctic winter and as a result, it is very difficult to say that atmospheric warming is the direct cause of melting. However that hasn’t stopped the climate alarmists.
The Figure 5 geologic map illustrates that the Larsen “C” segment is proximal to numerous, currently erupting volcanoes, semi-active volcanoes, and large, actively moving/heat-emitting faults all associated with the West Antarctic Rift System.
Not shown on this map is the likely presence of hundreds of additional heat-emitting seafloor hydrothermal vents. That’s because this area is largely covered by sea ice, very remote, and lashed by rough weather conditions.
Limited seafloor exploration in this area has identified currently active hydrothermal vents. Many more are almost certainly strewn across this entire region.
An excellent visual and well-mapped example of heat flow from the Larsen Shelf Area is Deception Island (see Figure 5), which is located a mere 120 miles west of the Larsen “C” segment.
Geologically, Deception Island is a currently active six-mile-wide collapsed volcano (“Caldera”). This volcanic feature extends a great distance outward and downward into the surrounding ocean with associated earthquakes occurring in 1994, 1995, and 1996. Since recordkeeping began, it has moderately erupted in 1820, 1906, 1910, 1967, 1969, and 1992.
Early explorers used the partially protected bay created by this collapsed volcano as a harbor, but on occasion, they had to abandon their moorings when the seawater in the bay boiled (see quote below).
More modern research stations located here in the 1960s had to temporarily abandon the island when the volcano moderately erupted covering everything in ash and cinders.
“The fifth volcano, off the northern tip of the Antarctic Peninsula, is a crater that has been ruptured by the sea to form a circular harbor known as Deception Island. Beginning in the 1820s, it was used as shelter by sealing fleets from New England and later by whalers. On occasion, water in that harbor has boiled, peeling off bottom paint from the hulls of ships that did not escape in time. An eruption a decade ago damaged research stations established there by both Britain and Chile. This volcano and the two newly discovered ones on the opposite side of the peninsula, the longest on Earth, are thought to be formed by lava released from a southeastward-moving section of the Pacific floor that is burrowing under the peninsula in the same process thought to have formed the Andean mountain system farther north, in South America.” (see here)
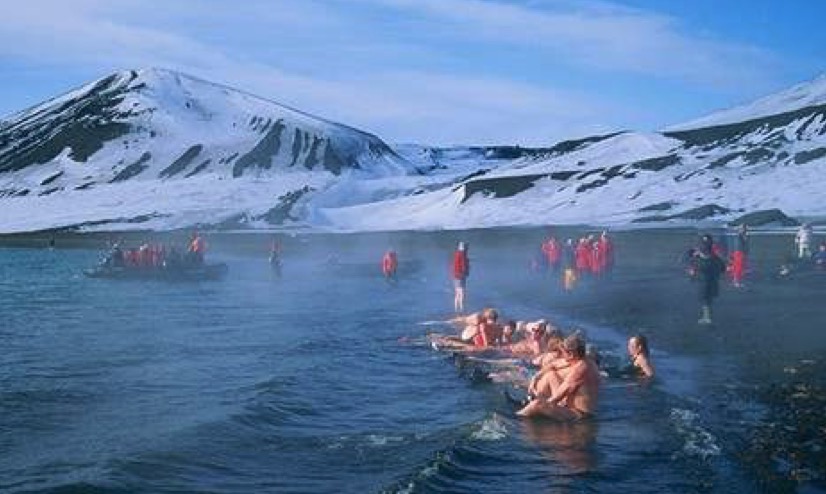
The photo in Figure 6 of the Deception Island Harbor is real. Those are tourists soaking in steaming hot ocean water along the shoreline of the Deception Island Bay which is a mere 120 miles west of the Larsen Ice Shelf.
Keep in mind this is Antarctica, the coldest place on Earth and where temperatures plummet to minus 129 degrees. This is not Miami Beach.
Granted, the break-up processes of the Larsen Area “C” ice are complicated, and there’s little doubt that geological heat flow is playing a key role in this bottom melting and ongoing breakup process. Who knows what heat-flowing, geologic features exist directly beneath this portion of the Larsen Ice Shelf?
Summary
Significant amounts of geological data and observations indicate that the Larsen Shelf Area lies along and owes its very existence to active faulting, volcanic eruptions, and molten lava intrusions associated with the West Antarctic Rift System.
A rift system that is ripping Antarctica apart and in the process, acting to warm adjacent ocean waters and landmasses, and melt overlying glaciers and sea ice.
In a very broad sense, these West Antarctic Rift-related processes fit well into Plate Climatology Theory, which states that many of Earth’s major rift systems have a significant and underappreciated effect on Earth’s climate and climate-related events.
Failure by the media, politicians, and most climate scientists to mention geological heat flow as a possible root cause of Larsen Shelf Area sea ice melting is difficult to reconcile. It is here suggested that the role geological forces play in changing our climate be given due consideration, especially concerning the West Antarctic Region.
James Edward Kamis is a Retired Geologist with 42 years of experience, a B.S. in Geology from Northern Illinois University (1973), and an M.S. in geology from Idaho State University (1977) who has always been fascinated by the connection between Geology and Climate. More than 12 years of research/observation have convinced him that the Earth’s Heat Flow Engine, which drives the outer crustal plates, is also an important driver of the Earth’s climate. The Plate Climatology Theory (plateclimatology.com) was formally introduced in October 2014 and published at the annual 2016 American Metrological Society Conference in New Orleans, LA on January 13, 2016 (see here)
ADDENDUM 1
- There are 61 known active, semi-active, or erupting volcanoes along the West Antarctic Rift System (WAR).
- Beneath West Antarctica’s glacial and sea ice, there is a huge interconnected network of liquid freshwater lakes and streams that lie beneath thousands of feet of glacial ice. This system is generated and maintained by geologically induced chemically charged hot springs that are proven to exist along the full length of the West Antarctic Rift/Fault trend (see here).
- Wells in West Antarctica which have drilled through thousands of feet of glacial ice and into bedrock have identified active hot springs with high-temperature liquid water and hot spring-like living microorganisms. Some of these geothermal hot springs are proven to be a source of the subglacial lakes.
- Researchers have recently confirmed the presence of two currently, mildly erupting volcanoes located beneath thousands of feet of West Antarctic glacial ice.
- Research by the University of Texas and others show that across large geographic areas associated with the West Antarctic Rift has proven the existence of very elevated geologically induced bedrock heat flow.
- Deep Ocean diving robotic subs have positively identified the presence of numerous high heat flow hydrothermal vents along the West Antarctic Rift’s northern extension.
- Earth has undergone an extremely active period of volcanic and earthquake activity during the last 3 to 5 years, especially from the major Deep Ocean fault systems such as those associated with the Pacific Rim of Fire and the Icelandic Mid-Atlantic Ocean Rift. It makes perfect sense that the West Antarctic Rift/Fault System that underlies the Larsen Ice Shelf has also become more active during this time frame.
- The 2015-2016 El Nino Ocean “Warm Blob” has now been proven to be caused by “natural forces” and not man-made or other purely atmospheric forces. These natural forces are almost certainly geological as per numerous previous Climate Change Dispatch articles (see here and here). If geological forces have the power to warm the entire Pacific Ocean, they can certainly act to warm the ocean beneath the Larsen Shelf Area.
- Climate scientists favoring man-made global warming continue to force-fit all anomalous warming events such as those in the Larsen Area into an atmospheric framework because this is the only abundant data source they have available. However, there is very little global atmospheric data that supports rapid local anomalous Larsen Shelf sea ice melting or local rapid ocean warming.
- The surface of our planet is just over 70% water and 90% of all active volcanoes are present on the floor of Earth’s oceans. Amazingly, only 3 to 5% of the ocean floors have been explored by human eyes and virtually none is monitored. This is especially true in the nearly unexplored/completely unmonitored deep regions of the oceans in and around the West Antarctic Rift and Larsen Shelf Area.
- Recent volcanic activity in Antarctica’s Kerguelen Plateau, including the recent eruption of the Big Ben volcano, is the likely source of significant warming and chemical charging of the ocean in this region (see here). As a side effect, this process is proven to have altered plankton blooms in this region and emphasizes the importance of geologically induced heat flow on Antarctica’s climate and climate-related events.
- Discovery of a huge sub-glacial lake caused by geothermal/fault-induced heat flow in the East Antarctic (see here).
- Research confirms that the melting of selected West Antarctic glaciers is from natural and non-human-induced heat (see here).
- Antarctica Ice Core information clearly shows that huge sub-polar ice cap West Antarctic volcanic eruptions have occurred regularly, for instance, 44,000 and 22,000 years ago. These monstrous eruptions broke through the ancient ice and spewed massive amounts of chemically charged soot onto the ancient ice sheets and into surrounding ancient oceans (see here).
- Information indicating that the presence of methylmercury, which comes from deep ocean hydrothermal vents, is powerful proof geological heat is at work in West Antarctica (see here).
REFERENCES
https://www.sciencedaily.com/releases/2004/05/040527235943.htm Discovery of Active Deep Sea Floor Volcano in Larsen Area
http://www.academia.edu/10915385/The_development_of_the_Deception_Island_volcano_caldera_under_control_of_the_Bransfield_Basin_sinistral_strike-slip_tectonic_regime_NW_Antarctica_ Geology of Deception Island West Antarctica
http://www.newsgrio.com/?p=102210
http://www.nbcnews.com/science/environment/iceberg-size-delaware-poised-break-antarctica-n703821
http://volcano.si.edu/volcano.cfm?vn=390050
https://wattsupwiththat.com/2008/01/22/surprise-theres-an-active-volcano-under-antarctic-ice/
http://usatoday30.usatoday.com/news/science/2004-05-20-new-volcano_x.htm
http://news.nationalgeographic.com/2016/11/foehn-winds-melt-ice-shelves-antarctic-peninsula-larsen-c/ Geologically Warmed Ocean alters winds and melts glacial ice.
https://www.volcanodiscovery.com/seal-nunataks-group.html
http://www.seeker.com/three-volcanoes-erupting-nasa-satellite-2031377713.html Three Volcanoes North of Antarctica Erupt at Once
http://earthobservatory.nasa.gov/IOTD/view.php?id=87995 Bristol Island Eruption May 1, 2016
https://www.nsf.gov/news/news_summ.jsp?cntn_id=100385
http://www.ldeo.columbia.edu/research/blogs/operation-icebridge-scientists-map-thinning-ice-sheets-antarctica Lamont Doherty Involvement in Operation Ice Bridge Antarctica
http://www.academia.edu/15165441/Late_Holocene_tephrochronology_of_the_northern_Antarctic_Peninsula
http://www.academia.edu/5715929/Volcanic_tremors_at_Deception_Island_South_Shetland_Islands_Antarctica Deception Island South Shetland Islands Antarctica
http://www.sciencedirect.com/science/article/pii/S0377027314002492
http://www.smh.com.au/environment/fire-and-ice-melting-antarctic-poses-risk-of-volcanic-activity-study-shows-20140520-zrj06.html Mantle Under Larsen Shelf Rises and Activates Volcanoes.
http://earthsky.org/earth/new-glimpse-of-geology-under-antarcticas-ice Bentley Subglacial Trench in West Antarctica
https://www.nasa.gov/pdf/121653main_ScambosetalGRLPeninsulaAccel.pdf Map Larsen Ice Shelf
http://www.nytimes.com/1982/05/24/us/2-volcanoes-found-in-antarctica.html
http://www.sciencedirect.com/science/article/pii/089598119090022S Deception Island and Bransfield Strait
http://visibleearth.nasa.gov/view.php?id=87995
http://appinsys.com/GlobalWarming/RS_AntarcticPeninsula.htm Antarctic Near Surface Temperatures from NASA Satellite Show West Antarctica is Anomalously Warm Along the West Antarctic Rift and Associated Volcanoes
https://www.nytimes.com/interactive/2017/06/09/climate/antarctica-rift-update.html?_r=0


I have been pointing this out for years.
Its all a natural process its just we have the Green Nuts looking to get big headlines in some birdcage liner and from the talking heads as well