In 1971, National Geographic published this map of late summer Arctic sea ice extent.
Here is their current map.
The image below overlays the current NSIDC map (green) on the 1971 National Geographic Map (red.) There is less ice in the western Arctic than 1971, and more ice in the Eastern Arctic
But what is really interesting in the map above is the position of the NSIDC median ice edge line, which extends far outside the 1971 area. This is because NSIDCs ignore all of the pre-1979 data when sea ice extent was very low.
Arctic Sea Ice Fraud | The Deplorable Climate Science Blog
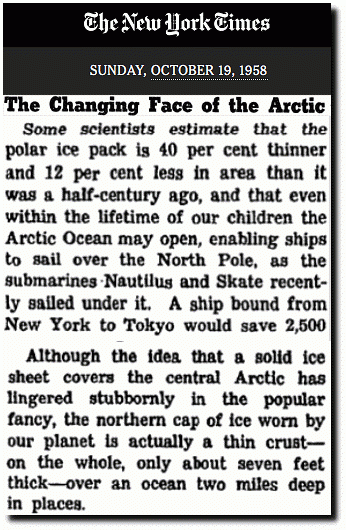
In the 1950’s experts thought the Arctic would be ice-free within a generation.
The Changing Face of the Arctic; The Changing Face of the Arctic
In order to create their fake linear trend graphs, they start right at the peak in 1979 and ignore all the prior data. Junk science doesn’t get any worse than that.
ftp://ftp.oar.noaa.gov/arctic/documents/ArcticReportCard_full_report2016.pdf
Read more at Real Climate Science


Looks like the New York Slimes is just rerunning old news from almost 60 years ago nothing new TIME has done the same back when there was to be a New Ice Age and Global Cooling
The people who cherry-pick statistics get the headlines. The people who call them out on it don’t . Maybe the MSM could editorialize on cherry picking, but I wouldn’t hold my breath waiting for them.