 We are now getting close to finalizing our methodology for computing the urban heat island (UHI) effect as a function of population density and will be submitting our first paper for publication in the next few weeks.
I’ve settled on using the CONUS (Lower 48) U.S. region as a demonstration since that is where the most dense network of weather stations is. We are using NOAA’s V4 of the GHCN monthly dataset. [emphasis, links added]
I’ve previously described the methodology, where I use many thousands of closely-spaced station pairs to compute how temperature between stations changes with population density at 10×10 km resolution.
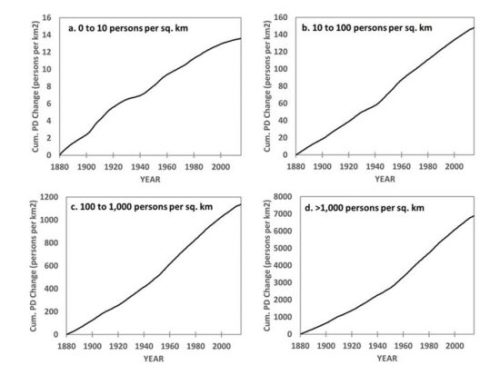
This is done for 22 classes of 2-station average population density, and the resulting cumulative UHI curves are shown in Fig. 1.

The very fact that there is a strong urban warming signal in the homogenized data necessitates that there must be a UHI impact on trends in those data. This is because the urban stations have grown substantially in the last 130 years.
A recent paper by Katata et al. demonstrates that the homogenization technique used by NOAA does not correct urban station trends to look like rural station trends.
It does breakpoint analysis, which ends up adjusting some stations to look like their neighbors, whether urban or rural.
To the extent that spurious warming from UHI is gradual through time, it “looks like” global warming and will not be removed through NOAA’s homogenization procedure.
And since all classes of stations (rural to urban) have undergone average population growth in the last 130 years, one cannot even assume that rural temperature trends are unaffected by UHI (see Fig. 2).

The regression estimates of change in temperature with population density (dT/dPD) used to construct the curves in Fig. 1 were used at each station in the U.S. and applied to the history of population density between 1895 and 2023.
This produces a UHI estimate for each station over time.
If I compute the area-average GHCN yearly summertime temperature anomalies and subtract out the UHI effect, I get a UHI-corrected estimate of how temperatures have changed without the UHI effect (Fig. 3).

The data in Fig. 3 are from my 1 deg latitude/longitude binning of station data and then area-averaged.
This method of area-averaging for CONUS produces results extremely close to those produced at the NCDC “Climate at a Glance” website (correlation = 0.996), which uses a high resolution (5 km) grid averaged to the 344 U.S. climate divisions then averaged to the 48 states then area-averaged to provide a CONUS estimate.
UHI Warming at Suburban/Urban Stations is Large
The UHI influence averaged across all stations is modest: 24% of the trend, 1895-2023. This is because the U.S. thermometer network used in Version 4 of GHCN is dominated by rural stations.
But for the average “suburban” (100-1,000 persons per sq. km) station, UHI is 52% of the calculated temperature trend, and 67% of the urban station trend (>1,000 persons per sq. km).
This means warming has been exaggerated by at least a factor of 2 (100%).
This also means that media reports of record-high temperatures in cities must be considered suspect since essentially all those cities have grown substantially over the last 100+ years, and so has their urban heat island.
Read more at Dr. Roy’s Blog


With havin so much content do you ever run into any
issues of plagorism or copyright infringement?
My blog has a lot of completely unique content I’ve either
created myself or outsourced but it seems a lot of it is
popping it up all over the web without my agreement.
Do you know any techniques to help reduce content from being ripped off?
I’d truly appreciate it.
Good day! This is my first visit to your blog!
We are a collection of volunteers and starting a new project in a community in the
same niche. Your blog provided us valuable information to
work on. You have done a marvellous job!
Airports that were situated far from cities are now surrounded by them. Airport traffic has grown exponentially, the jets are bigger, runways have multiplied. They also are an important source of historical weather data. The UHI influence should be culled from any CO2 ,greenhouse gases research into global warming. Why do the warmists need to be told the obvious?