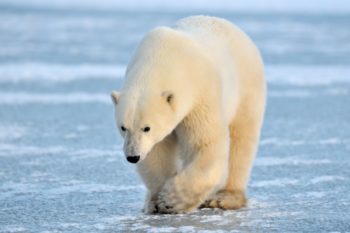
This is not a “ho-hum” year for polar bears: it means that since 2007, they have triumphed through 10 or 11 years1 with summer ice coverage below 5.0 mkm2 — levels that in 2007 were expected to cause catastrophic declines in numbers.
Summer sea ice below 5.0 mkm2 was not expected to occur until about 2050, according to 2005/2006 sea ice models and polar bear specialists at the US Geological Survey (USGS).
Polar bear survival models predicted 2/3 of the world’s polar bears would disappear when ice levels reached this threshold for 8 out of 10 years (Amstrup et al. 2007, 2008; Hunter 2007) but polar bears have been more resilient than expected (Crockford 2017, 2018; Crockford and Geist 2018).
In fact, in many areas (like the Chukchi Sea, the Barents Sea, and Foxe Basin) polar bears are thriving despite dramatic declines in summer sea ice coverage (Aars et al. 2017; ACSWG 2018; Peacock et al. 2013; Regehr et al. 2016; Stapleton et al. 2016).
The sea ice models used to support the addition of polar bears to the US Endangered Species List as ‘threatened’ with extinction suggested sea ice levels from 3-5 mkm2 would not occur until mid-century, yet they dropped before the ink was dry on the 2007 USGS Reports (ACIA 2005; Hassol 2004; Holland et al. 2006; Solomon et al. 2007; Zhang and Walsh 2006).
The ice extent charts from the University of Bremen (below) show ice that’s 50% concentration or greater at the date of the seasonal minimum (19th September): what polar bear specialists define as preferred habitat (Amstrup et al. 2007).
Compare the minimum shown above to the coverage predicted for 2050 and to the coverage at the minimum in 2012 (the NSIDC image is here):

Figure 3. Predicted sea ice changes (based on 2004 data) at 2020, 2050, and 2080 that were used in 2007 to predict a 66% decline in global polar bear numbers vs. an example of the sea ice extent reality experienced since 2007 (shown is 2012). See Crockford 2017 for details.
WATCH: Polar Bear Scare Unmasked: The Saga Of A Toppled Global Warming Icon
FOOTNOTE
- Of these 12 years, two were only marginally above 5.0 mkm2 and one (2014) was within the margin of error for the threshold: 2013 (5.05) and 2014 (5.03). Only 2009, at 5.12 mkm2, was above that threshold. NSIDC states (Table 1) that values within 40,000 km2 are considered a tie, so the margin of error for these estimates can be assumed to be about 40,000 km2. That means the true value for the minimum at 2014 could be below 5.0 mkm2. Values used by the USGS were for 50% sea ice concentration, which would, in any case, be slightly below the 15% concentration value used by NSIDC: that fact means that 2013 was probably below 5.0 mkm2 as well.
Read more at Polar Bear Science





Listing Polar Bears this eater of baby seals was purely political and the Hard Greens using it as their Global Warming/Climate Change mascot its just the usial parading before the news cameras by the Eco-Wackos