Per a new study, the last 200 years of global warming are associated with cloud cover decline, and this decreasing cloud albedo can be linked to “the dominant roles of external forces – volcanic, solar, and oceanic – in their mutual influence after the LIA [Little Ice Age].” [emphasis, links added]
Scientists have repeatedly reported a satellite-observed (CERES) cloud cover albedo decline that has led to an increase in solar radiation absorbed by the Earth’s oceans – a trend that explains the post-2000 temperature increase (Dübal and Vahrenholt, 2021, Loeb et al., 2021, Stephens et al., 2022, Koutsoyiannis et al., 2023, Loeb et al., 2024, Nikolov and Zeller, 2024).
Scientists have now formulated a new 1500 to 2022 CE reconstruction of cloud cover over the Mediterranean region.
The authors suggest their reconstruction of cloud cover may be representative of more than just this region, as it is a product of large-scale processes that may “transcend geographical boundaries.”
In other words, what happens in the Mediterranean region may well have global implications.
The reconstruction indicates the modern declining cloud cover trend may not only have been occurring since 2000, except for a brief increasing period from about 1945 to 1980 (which coincided with a global cooling trend), but has also been ongoing for over 200 years.
The “turning point” years were 1815-1818 following the eruption of Mount Tambora. From that point on there was a precipitous decline in cloud cover that departs from multi-decadal variability.
The authors suggest the “dominant” factors linked to the post-1800s include solar forcing, volcanic forcing, and the Atlantic Multidecadal Oscillation (AMO).
“Our study…indicating the dominant roles of external forces – volcanic, solar, and oceanic – in their mutual influence after the LIA”
“This combination of factors [AMO surging to a positive phase, a significant rise in solar forcing] likely contributed to a substantial decrease in cloud cover in the Mediterranean area.”

Interestingly, the authors also repeat the model-based assumption that the post-LIA rising temperatures could have been a contributing causal factor in the 1800s-to-present cloud-cover decline.
In other words, the warming led to cloud decline, and not the other way around. This assumption is odd, at best.
It is well known warmer seawater adds more water to the air than cooling seawater. This is why, for example, water vapor concentrations reach 35,000 ppm in the tropics, but less than 1,000 ppm at the poles.
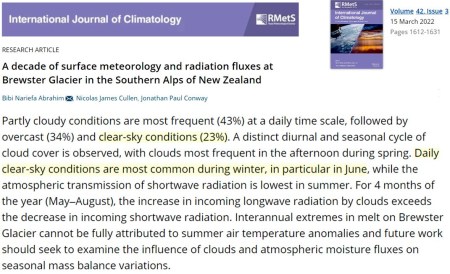
Also, it is well known that warmer summers are cloudier than colder winters (see Malliard et al., 2021 and Abrahim et al., 2022 below, for example). Cloudier summers can be 10 to 15°C warmer than clearer-sky winters across the middle and high latitudes.
In contrast, the modern warming trend of only tenths of a degree in recent decades could only produce negligible changes in clouds relative to these much larger seasonal temperature changes.
Besides, a decline in cloud cover is the opposite of what occurs with warmer temperatures anyway.

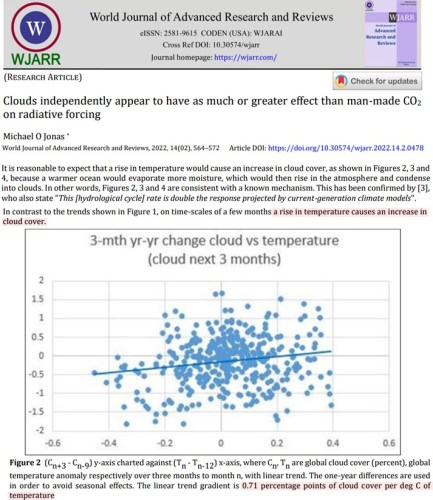
Furthermore, real-world observations (Jonas, 2022) are very clear on the question of whether warming induces a decline in cloud cover.
“A rise in temperature causes an increase in cloud cover.”
“0.71 percentage points of cloud cover per deg C of temperature.”

Anthropogenic global warming apologists want to believe the observed decline in cloud cover in recent decades is human-caused.
Thus, climate model inputs have been programmed to say warming from rising greenhouse gases leads to cloud decline, and cloud decline leads to more warming – a perpetual, runaway positive feedback.
Problematically, real-world observations show warming leads to cloud increases, not decreases. Thus, neither warming nor rising greenhouse gases can explain the observed modern cloud decline.
And since declining cloud cover, a function of “unforced internal variability,” allows more solar radiation absorption at the surface, this can explain modern warming.
Top photo by Eirene Thoms on Unsplash
Read more at No Tricks Zone


Empirical data always needs to be considered where it exists. One of the most compelling is that 40% of the warming blamed on man occurred between 1910 and 1941 when the carbon dioxide levels were relatively low and raising very slowly. This is real data. In addition, it appears that the mini ice age, roman and medieval warm periods happened with no large change in carbon dioxide concentrations.
For 20 years I have read thousands of articles from all over the world and from every point of view. It can all be summed with one word, “Fraud.” This is to support the many agendas hitch hiking on it that can not make it on their own merit. This includes new and hire taxes, getting meat off of the table, de-growth, Marxism, and many others.
One fact that we need to keep in mind is carbon dioxide is beyond its saturation point as far as its ability to cause warming. As such other phenomena have to be the cause. That could be cloud cover, changes in solar radiation, changes in cosmic radiation, or some combination. One thing is certain is there is no justification for the effort to cut back on CO2 emissions.
Kenneth Richard columns should always be ignored. He promotes junk studies whose conclusions are based on inaccurate. or no, data and they ignore all i of greenhouse warming. A consistently biased CO2 denier and a hack writer. If you want to deny the greenhouse effect, or minimize it, Richard is your hero.
It should be noted that Ritard Greene, recently on his website, dedicated himself to attacking conservatives.
It should also be noted that his old moniker was DoubleSix6Man… 666Man. The mask is off of this wild-eyed gibbering leftist loon. LOL
He’s hijacked CAGW, claimed he came up with it, buys into every single premise of the warmists, arrives at the same conclusions as the warmists, defends consensus ‘science’, leaps to the defense of leftist woketards, and attacks anyone using scientific principles to prove CAGW is nothing more than a poorly-told easily-disproved climate fairy tale… a mathematically-based scam.
He’s a barely-closeted leftist and a warmist. His entire shtick is to claim that the warming is good, so you should be a warmist like him. That’s it, that’s all.
He’s here to trick legitimate skeptics over to the side of warmism, as means of incrementalizing them into leftism.
Of course, as I show here:
https://www.patriotaction.us/showthread.php?tid=2711
… he’s just as wrong as the leftist warmists who claim CAGW is bad. He can’t help but be… the only thing he’s changed from consensus warmism is that it’s actually good for you, so you should just lie down and take the economic fraud and global socialism that is concomitant with it.
He keeps attempting to claim I am wrong, but somehow he’s never been able to elucidate exactly which scientific principle (taken straight from physics tomes) he claims me to have corrupted… he doesn’t even understand those scientific principles, so there’s no way possible that he ever will be able to. LOL
LOL, I have read your comments on several sites and always agree with you even though the math is over my head. I always disagree with Richard Greene. I am a frustrated physics major. I wanted to major in physics in college but I unfortunately didn’t have a head for the required higher math. So I changed my major to history, something else I love.
I believe history is on your side. If climate alarmists were right at least some of their major predictions would have come true over the last 50+ years. But, as we know, polar bears are thriving, the Great Barrier Reef is at record levels, crop production continues to set record levels worldwide, sea level rise has not accelerated, climate deaths have declined since 1900, wildfires have also declined since 1900 and life expectancy has risen BECAUSE of fossil fuels. Cold still kills more than warm. Ask the Donner Party. The warming since 1850 has been a complete blessing by God for humanity.
Climate alarmism is simply a vehicle for the far left to institute collectivism worldwide. The novel “1984” is their roadmap. I’m glad it was required reading in my high school back in the 1960’s.
You are on the right track and I believe history is on your side. I’ll leave the math to you. I’ll continue to read and enjoy your comments.
In fact:
https://i.imgur.com/gFoCGZW.png
Look at the sea levels in each photo, taken at high tide… the later photo sea level is lower than the earlier photo sea level.
They’re just outright lying to us.
https://jennifermarohasy.com/2022/04/washed-away-a-short-film-about-sea-level-fall/
“After being buried under several kilometres of ice, much of Europe and North America is experiencing uplift. For example, the ice retreated from Sweden 9,900 to 10,300 years ago and large-scale uplift is still occurring to the extent that the tidal gauge in Stockholm shows sea levels have fallen by about 50 cm over the last 129 years — an average annual rate of fall of 3.9mm per year. The uplift at Juneau, in Alaska, is even more extreme: in just 80 years sea levels have fallen by 120cm at a steady rate of minus 15mm per year. This reality jars with the notion of catastrophic sea level rise, so the IPCC ‘detrends’ the measurements from these tidal gauges, until they show sea level rise.”
Lot of references to peer-reviewed studies showing sea level is and has been falling worldwide since the Holocene High Stand between 8000 and 2000 BP:
https://jennifermarohasy.com/2020/04/falling-falling-sea-levels-and-a-full-moon/
Accordi.A, Carbone, F 2016. Evolution of the siliciclastic-carbonate shelf system of the northern Kenyan coastal belt in response to Late Pleistocene-Holocene relative sea level changes. Journal of African Earth Sciences. Volume 123, November 2016, Pages 234-257
Baker,R.G.V., Haworth,R.J; 2000. Smooth or oscillating late Holocene sea-level curve? Evidence from the palaeo-zoology of fixed biological indicators in east Australia and beyond. Marine Geology 163, 367-386.
Baker,R.G.V., Haworth,R.J., Flood,P.G; 2001. Warmer or Cooler late Holocene palaeoenvironments? Interpreting south-east Australian and Brazilian sea level changes using fixed biological indicators and their d18 Oxygen composition. Palaeogeography, Palaeoclimatology, Palaeoecology 168. 249-272.
Baker,R.G.V., Haworth,R.J., Flood,P.G; 2001. Inter-tidal fixed indicators of former Holocene sea levels in Australia; a summary of sites and a review of methods and models. Quaternary International 83-85. 257-273.
Baker,R.G.V., Haworth,R.J., Flood,P.G; 2005.An Oscillating Holocene Sea-level? Revisiting Rottnest Island, Western Australia, and the Fairbridge Eustatic Hypothesis. Journal of Coastal Research, Special Issue no.42.
Bracco,B. et al; 2014. A reply to “Relative sea level during the Holocene in Uruguay. Palaeogeography, Palaeoclimatology, Palaeoecology.Volume 401.
Bradley, S, Milne,G, Horton,B, Zong,Y 2016. Modelling sea level data from China and Malay-Thailand to estimate Holocene ice-volume equivalent sea level change. Quaternary Science Reviews 137:54-68
Chiba,T et al;, 2016. Reconstruction of Holocene relative sea-level change and residual uplift in the Lake Inba area, Japan. Palaeogeography, Palaeoclimatology, PalaeoecologyVolume 441, Part 4,Pages 982-996
Clement, A, Whitehouse,P, Sloss,S 2015. An examination of spatial variability in the timing and magnitude of Holocene relative sea-level changes in the New Zealand archipelago. Quaternary Science Reviews. Volume 131, Part A. January 2016, Pages 73-101
Haworth,R.J., Baker,R.G.V., Flood,P.G; 2001. Predicted and observed Holocene sea-levels on the Australian coast: what do they indicate about hydrostatic models in far field sites? Journal of Quaternary Research 17. 5-6.
Lee, S., Currell. M, Cendon, D. 2015. Marine water from mid-Holocene sea level highstand trapped in a coastal aquifer: Evidence from groundwater isotopes, and environmental significance. Science of The Total Environment. Volume 544. February 2016, Pages 995-1007
Lunning,S, Vahrenholt, F. Im südlichen Afrika lag der Meeresspiegel vor 5000 Jahren um 3 m höher als heute- Kategorien: Allgemein, News/Termine.25. Juni 2018 | 07:30
Oliver and Terry, 2019. Relative sea-level highstands in Thailand since theMid-Holocene based on 14C rock oyster chronology. Palaeogeography, Palaeoclimatology, Palaeoecology,Volume 517. Pages 30-38
Prieto,A. Peltier, W. 2016. Relative sea-level changes in the Rio de la Plata, Argentina and Uruguay: A review. Quaternary International.
Sloss, Craig R,: 2005. Holocene sea-level change and the amino-stratigraphy of wave-dominated barrier estuaries on the southeast coast of Australia, PhD thesis, School of Earth and Environmental Sciences, University of Wollongong, 20. http://ro.uow.edu.au/theses/447.
Sloss, C.R, Murray-Wallace,C.V, Jones.B.G; (2007). Holocene sea-level change on the southeast coast of Australia: a review. The Holocene 17, 7. 999-1014.
Strachan K, et al;, 2014. A late Holocene sea-level curve for the east coast of South Africa. S. Afr. j. sci. vol.110 n.1-2
Which means the IPCC is lying to everyone. They should be defunded and prosecuted for defrauding taxpayers.
AUGUST 18, 2022 1,200 Scientists and Professionals Declare: “There is No Climate Emergency”
The political fiction that humans cause most or all climate change and the claim that the science behind this notion is ‘settled’, has been dealt a savage blow by the publication of a ‘World Climate Declaration (WCD)’ signed by over 1,100 scientists and professionals.
https://dailysceptic.org/2022/08/18/1200-scientists-and-professionals-declare-there-is-no-climate-emergency/