More ice in Hudson Bay and adjacent regions than we’ve seen at this time of year for more than two decades: not since 1993 has there been as much polar bear habitat in the 2nd-last week of November.
The anomaly chart for this week is almost all blue:

Other years back to 1994 had much less ice for the 2nd-last week in November, as the charts below show. Colour charts are only available from 2004.
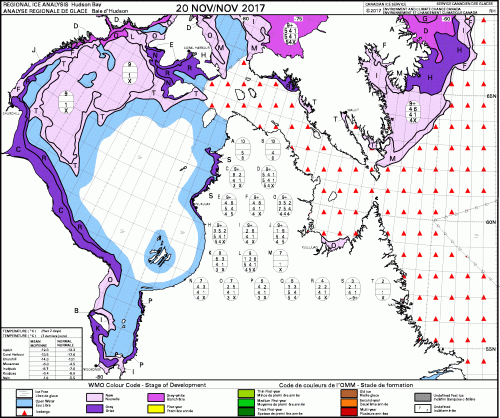
Here is this year’s ‘stage of development’ chart for 19 November:

In a graph, it looks like this:

In 2004, there was more ice in the northwest but less along the coast and in Hudson and Davis Straits:

In 2005, much less ice overall:

In 2006, there was even less than 2005:

In 2007, after the 2nd lowest summer ice extent since 1979, the picture was better (but not by much):

And in 2010, the ice coverage was very low on this date:

2012 was the lowest summer extent since 1979 and by late November there was little ice on the bay but ice extended south along the shore all the way into James Bay:

In 2016, when the bears did not leave shore until the first week of December, ice had formed on this date but got blown offshore:

Last year (2017) there was thicker ice along the coast but less ice in the strait than this year but polar bears left to go hunting on the ice about the same time (2nd week of November), as early as they did in the 19780s:

Last problem bear report of the season from Churchill (week 20 or after 5 months on land for most bears):

Read more at Polar Bear Science


