
Denver and other cities just shattered a March heat record.
The media immediately framed it as further proof of a climate system pushed beyond its limits by human activity. [some emphasis, links added]

The problem: the record was set in 1971.
“Saturday’s high also broke the record for the highest temperature ever recorded in the month of March, which had just been set Thursday and Friday, when Denver hit 85 degrees. The old all-time March temperature record was 84 degrees on March 26, 1971.”
If today’s heat is evidence of something unprecedented, then what exactly was happening in 1971?
That question alone should force a pause before jumping to conclusions. When we step away from the headlines and actually examine the data, a very different picture begins to emerge.
What Long-Term Records Actually Show
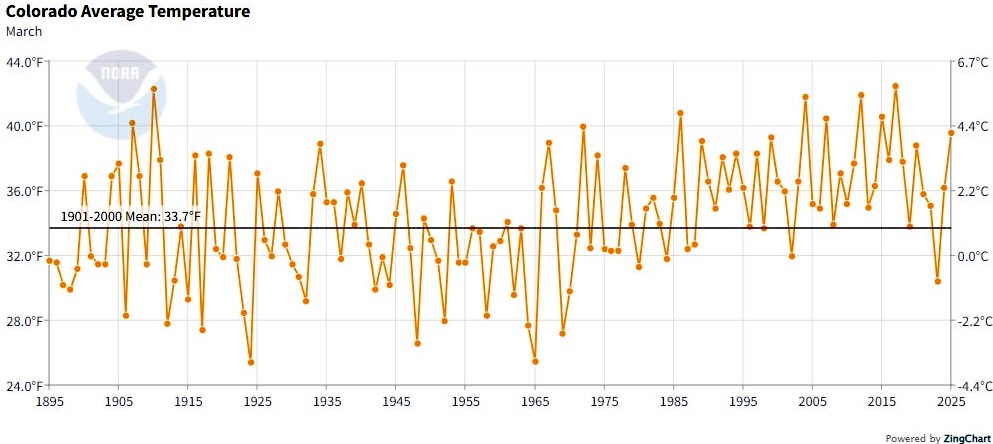
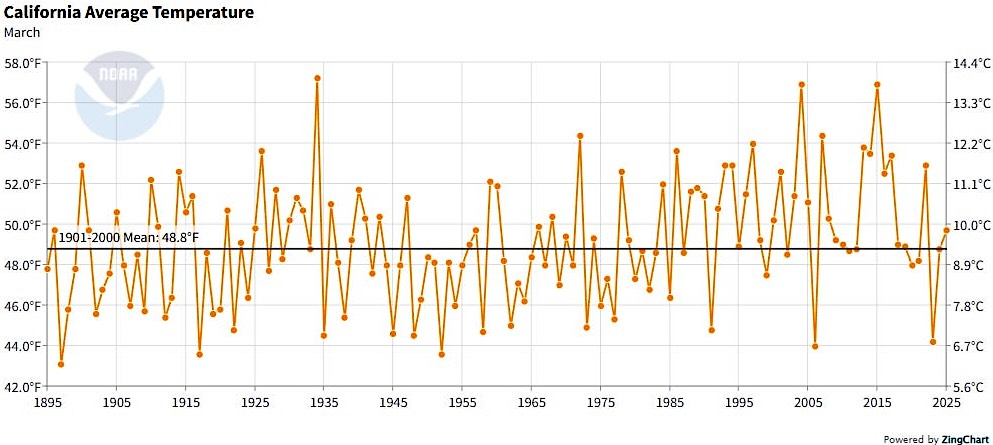
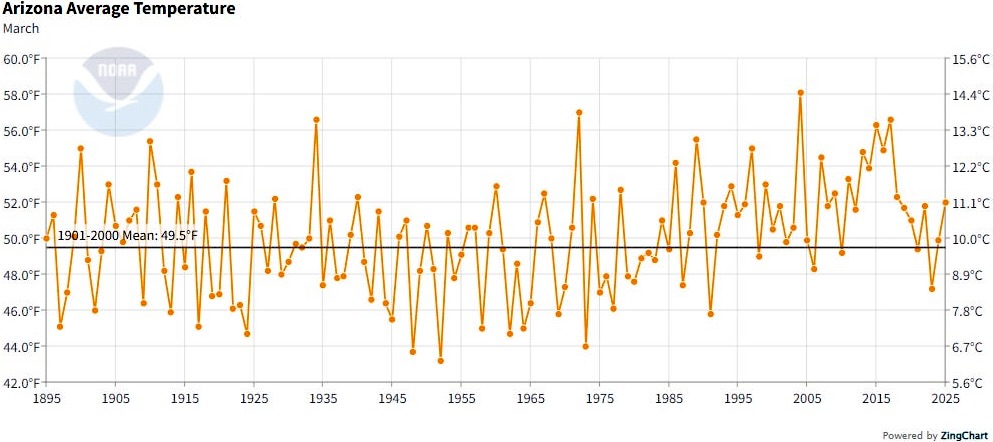
To understand what is really happening, we need to step back and look beyond a single event. The statewide March temperature records for Colorado, California, Arizona, and Washington extend back to the late nineteenth century and provide a much more complete view of the system.
What these records reveal is not stability followed by sudden disruption. They reveal a system that has always been highly variable.
In Colorado, the March temperature record fluctuates dramatically from year to year, with warm periods in the early twentieth century that rival or exceed many modern values.
The same pattern appears in California, where large spikes in March temperatures occur well before the recent period of elevated atmospheric carbon dioxide.
Arizona shows similar behavior, with pronounced warm anomalies scattered throughout the record, including periods in the early and mid-twentieth century that are comparable to recent years.
Washington State, often thought of as more climatically stable, exhibits the same jagged variability with no clear monotonic progression that would suggest a simple linear relationship with greenhouse gas concentrations.
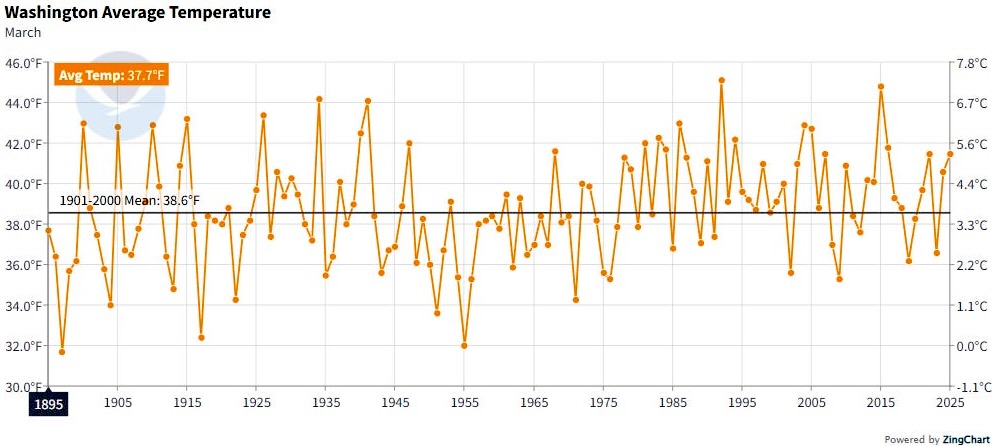
What stands out across all four states is not a sudden shift or acceleration but persistent variability. Warm years cluster, cool years cluster, and extremes appear throughout the record.
The modern period does not stand apart as uniquely volatile or unprecedented. Instead, it fits within a long-established pattern of fluctuation.
This Is Exactly What Natural Variability Looks Like
The climate system is not static. It is dynamic, nonlinear, and influenced by a wide range of interacting processes. When we extend a record over more than a century, the probability of encountering extreme values increases naturally.

This is not evidence of a system breaking down. It is evidence of a system being observed long enough to reveal its full range.
Every year, somewhere on the planet, a record is set. That is not evidence of a changing system. It is the expected outcome of a long and expanding dataset. The longer we measure, the more extremes we will observe.
The current event aligns with a well-understood atmospheric configuration. A strong ridge has developed over the western United States, coinciding with a transition from La Niña toward El Niño conditions and warmer-than-average coastal waters in the eastern Pacific.
These are classic drivers of regional heat events. They have operated in the past, and they will continue to operate in the future.
Historical Context Cannot Be Ignored
The most severe heatwaves in United States history still occurred in the early twentieth century, particularly during the 1930s. As discussed in my prior work, Heatwaves show no correlation with atmospheric GHG concentrations or emissions; the Dust Bowl era remains the benchmark for extreme heat in the observational record.

These events occurred when atmospheric carbon dioxide concentrations were far lower than today.
This is not a minor detail. It is central to the discussion. Any claim that modern heat events are fundamentally different must reconcile with the fact that more extreme events occurred under very different climatic conditions.
Attribution Claims Are Overstated
We are increasingly told that events like this would not have been possible without human influence. That claim is presented with a level of certainty that is not reflected in the underlying science.
Attribution studies do not observe reality. They simulate it. They compare model-generated worlds with and without human emissions and then assign probabilities to outcomes.
That is not a direct measurement. It is an inference layered on many assumptions.
When past observations clearly demonstrate that similar events have occurred, the assertion that they are only possible in a modern warming world becomes difficult to defend.
Measurement Matters More Than Most Realize
Another critical aspect that is often overlooked is how and where temperatures are measured. Many of the stations contributing to these records are located in environments that have changed substantially over time.
Airports, expanding urban areas, and infrastructure development all introduce localized warming influences that can affect recorded temperatures.
I explore this in detail in Can We Really Trust the Global Temperature Record, where I examine how station placement, adjustments, and data processing can influence the final temperature record.
When we interpret new records, we must consider not only the numbers themselves but also the context in which they are measured.
Irrational Fear is written by climatologist Dr. Matthew Wielicki and is reader-supported. If you value what you have read here, please subscribe and support the work that goes into it.
Read rest at Irrational Fear


Currently in ‘winter quarters’ in the 29 Palms area, southern California. Had one day at 102 °. A sensible figure for late summer, just occurring at a different time of the year. Locals are prepared for these temperatures. Must admit I took the ready-use firewood outside a few days ago.
I have lived in Colorado since 1985, first in Fort Collins & Windsor, both about an hour north of Denver and for the last 10 years just south and east of Denver. Variability is what happens here. Snow storms as early as mid-September and as late as Mother’s Day, temps during the winter with temps as low as -20F or highs in the 60s or higher. But average low is around15-20F and highs in the mid-40s. March is typically our snowiest month with April second but some years we may get 2 or more feet of snow in December that typically sees only less than a foot total. So what we’ve seen this winter has been warmer and drier than anyone can remember but as noted in the column that the Dust Bowl had warmer temps and drier than this year.
Great Job!