However, for the past two decades, global surface air temperatures have not warmed to the degree predicted by the models, which lack of warming has been a conundrum to the climate alarmist movement.
The latest group of researchers to document this so-called global warming hiatus (GWH) period is that of Sun et al. (2018).
Focusing their research on the region of northeast China, the seven Chinese scientists analyzed the temperature records of 118 stations that were obtained from the China Homogenized Historical Temperature Dataset.
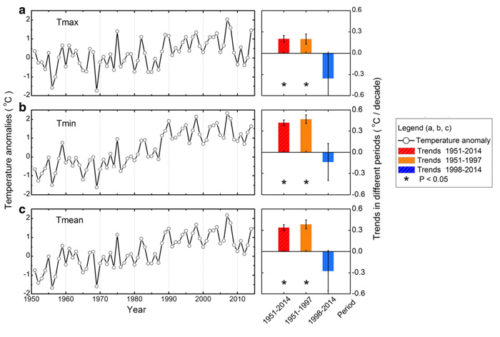
More specifically, they calculated and examined trends in both monthly and annual mean, maximum and minimum air temperatures at each of the 118 locations over the period 1951 to 2014. Results are illustrated in the figure below.
In describing their findings, Sun et al. say that their analysis “confirms a remarkable warming slowdown in northeast China during the GWH period, [which] hiatus is more obvious than those reported for mainland China and the globe.”
Indeed, the authors report that over the period 1998-2014, the annual mean temperature “consistently exhibits a cooling phenomenon in northeast China,” with trends of mean, maximum and minimum temperature of -0.28, -0.36 and -0.14 °C per decade, respectively (see the blue shaded bars in the right panel of Figure 1).
In addition, we note that a visual inspection of the annual maximum, minimum and mean temperature series, shown below, reveals that temperatures have been relatively flat (no trend) since the late 1980s, suggesting an even longer GWH period and the discrepancy between model projections and observations over the past three decades.
Further examination of the temperature records by the authors revealed that the recent annual mean temperature decrease is dominated by a “remarkable cooling of winter and spring.”
The significance of this finding was not lost on the authors, who note that “the cooling climate in northeast China during the past 17 years may pose a huge challenge to the agricultural activity and natural system.”
This is because northeast China is “one of the most productive regions of grains in the world,” where the grain yield amounts to approximately 20% of China’s total.
If the cooling trends continue, according to Sun et al., “the instability of agricultural production will increase in the future in this important grain production region of mainland China,” possibly leading to more frequent and more severe crop yield reductions and subsequent food shortages.
One can only hope the GWH will soon come to an end so that these real problems might not ensue.
Paper Reviewed
Sun, X., Ren, G., Ren, Y., Fang, Y., Liu, Y., Xue, X. and Zhang, P. 2018. A remarkable climate warming hiatus over northeast China since 1998. Theoretical and Applied Climatology 133: 579-594.

Read more at CO2 Science


Assuming this data is legitimate, it is for a few years in one small area of the globe, We know 1998 was a spike year, so a short downtrend from there is no big surprise. It’s a big world, and broader measurements of course show significant ongoing temperature increases.
Really? Where is this significant temperature increase showing up? Besides in your imagination?
Computer Models are only as honest as the ones who create them and design them their not accurate
I like it. Especially since the computer models have failed to predict the changes in temperatures since Mann, et al, created the models.
Shouldn’t the headline be “Computer Models Fail to Predict Temperatures in Northeast China”?
I’m guessing that NE China lacks the urban heat input.
Steve’s correct. These temperature records are probably unadulterated.
Well, golly. Perhaps the assumption that increasing CO2 in the atmosphere is not the trigger for warming the planet after all. Could that be the case? Nah, they just need to fudge the temperature readings and then we’ll be back to seeing the temperatures are going up as predicted. That method has worked for NOAA and NASA.