• Privacy Policy
  • About Us
  • Contact Us
Climate Change Dispatch
  • Home
  • Videos
  • Who We Are
  • Facts Vs. Fearmongering
    • Real science vs Junk Science
      • 1100-plus Peer-Reviewed Studies
      • 97% – Myth of the Climate Change Consensus
      • Michael Crichton: Aliens Cause Global Warming
      • Climate change and its causes
      • Climate Science Primer
      • CO2 is not pollution
      • Deceptive Surface Temperature Records
      • Editorial: Great Global Warming Hoax
      • Rules for Climate Radicals: Part 1
      • Rules for Climate Radicals: Part 2
      • Rules for Climate Radicals: Part 3
      • Why CO2 Is A Minor Player In Global Climate
      • Why Politicized Science Is So Dangerous
    • Facts Not Fear
      • A Simple Question For Climate Alarmists
      • Climate Change – The Facts
      • Climate Change Fears Are Empirically Baseless
      • Global Warming 101
      • Global Warming Q&A
      • Understanding The Medieval Warm Period
      • Ocean Cycles and Climate
      • Overview of Plate Climatology Theory
      • Precautionary Principle
      • Should We Celebrate Carbon Dioxide?
      • The Skeptics Handbook
      • Weather Versus Climate
      • Why I’m a GW skeptic
      • Winning the climate debate with facts
      • Why Aliens Cause Global Warming
    • Greenhouse FAQs
      • CO2, Plants, & Industry
      • How much have temps changed?
      • How much have temps changed?
      • How much have temps changed?
      • Is global warming real?
      • Measuring temperature
      • Swimming in CO2?
      • Scientists urge caution?
      • Today’s warming trend
      • Variations in temperature
    • Gore’s Greatest Goofs
      • Deconstructing the Truth
      • Fact-Checking Al Gore’s Latest Predictions
      • How Gore Created The Global Warming Hoax
    • Inside Real Climate
      • Closer look at the 97% Consensus
      • GW’s Amazing Story
      • IPCC gets failing grade
      • Real Climate Exposed!
      • Truth about Real Climate
      • We’ve Been Conned
      • What is there a 97% consensus about?
    • Behind the IPCC
      • 1,000 Scientists Dissent
      • Climategate: Caught Green-Handed!
      • Climategate Inquiries
      • Climategate Inquiries 2
      • NIPCC Report Now Available
      • Understanding the Climategate Inquiries
  • Submissions
  • Contact Us
No Result
View All Result
Climate Change Dispatch
No Result
View All Result

Climate Expert Exposes How Activist Scientists And MSM ‘Gaslight’ The Public On Hurricanes

by Roger Pielke Jr.
December 30, 2024, 2:02 PM
in Extreme Weather, News and Opinion, Politics, Science
A A
8
Share on FacebookShare on Twitter

hurricane winds pier
Hurricanes are the poster child of climate politics.

As you can see in the actual poster [below], a popular narrative exists that hurricanes are caused by carbon dioxide (CO2) emissions from power plants (or makes them more frequent, more intense, more wet, more slow, more fast). [emphasis, links added]

Like the movie poster [below], in which the hurricane is spinning the wrong way, evidence and research have not always conformed to the narrative.

Look at that spin!

A pseudoscientific cottage industry has sprung up that associates just about every notable hurricane with climate change. Today, I take a look at recent efforts to attribute hurricanes to greenhouse gas emissions.

The impacts of climate change on hurricanes are claimed to be huge. Here are some examples from 2024:

  • Hurricane Milton was 40% more likely.
  • Hurricane Helene was more than 100% more likely.
  • Typhoon Shanshan was 36% more likely.
  • Typhoon Gaemi was about 50% more likely.
  • Hurricane Beryl was almost 100% more likely.

Press releases making such incredible claims flood the zone after every major storm and are uncritically repeated by the major media around the world.

Let’s take a closer look at what lies behind these press releases. Like the hurricane spinning the wrong way in Al Gore’s movie poster, the attribution tricks sit out in plain sight, visible to anyone willing to have a look.

First Trick — Attribution Inflation

Earlier this month, Tropical Cyclone Chido made landfall in Mayotte, part of the archipelago between Madagascar and the African continent, before going inland across Mozambique. Chido was a small but powerful tropical cyclone that resulted in the deaths of almost 100 people.

In the days after the storm, the Grantham Institute at Imperial College London issued a press release claiming:1

The IRIS model estimates that climate change uplifted the intensity of a tropical cyclone like “Chido” from a Category 3 to Category 4. A “Chido” type storm is about +40% more likely in the 2024 climate compared to a pre-industrial baseline.

Wow, 40% — that is a big number!

It is about an order of magnitude larger than the most extreme projections of the IPCC AR6 for changes in tropical cyclone intensity by 2100.

It turns out that 40% is actually less than 3%.

Here is the trick: The Imperial College press release claims that a storm like Chido has changed from a 1 in 13.9-year event to a 1 in 10.1-year event — In other words, from an event with a 7.2% chance of occurring in any year to an event with a ~10% chance of occurring.

Taking the claim at face value, that means that a storm like Cyclone Chido is 2.8% more likely (i.e., 10% minus 7.2%). That wouldn’t sound too scary.

But if we round the return periods to 14 and 10 years respectively, and take the percentage change of the percentage change (10% divided by 7.14%) — Voila — We get a 40% change.

In a different context, the New York Times explains that “percentage change values may give a misleading impression of what is really happening.” Indeed.

We are already seeing the effects of climate change today in floods, fires, and storms. And the temperature keeps rising. By the end of the century, up to a quarter of the world is likely to be uninhabitable. —Grantham Foundation 2024

Second Trick — Begging the Question

The Imperial College approach to attribution assumes the conclusion that it seeks to prove. They do this by simply assuming that every storm is made stronger due to warmer oceans, which indeed have warmed due to increasing carbon dioxide and other greenhouse gases in the atmosphere.

With this starting point, it is straightforward to conclude that the storm that just happened was made more likely due to climate change. Imperial College explains:

The difference in the storm intensity and likelihood of this storm intensity between the counterfactual climate and today’s climate can be attributed to climate change.

Simple, right?

For instance, they provide an example of their method applied to Typhoon Haiyan (2013, Philippines) which :

According to IRIS, in a cooler climate without human-caused warming, typhoons as powerful as Haiyan are expected to hit the Philippines about once every 9,300 years, but in the climate with 0.8°C of warming, similar typhoons are expected to occur about once every 130 years.

Wow! Using the “percentage of a percentage” trick to characterize increased likelihood means that a storm like Haiyan was 7,000% more likely due to climate change.2

The problem with assuming a direct relationship between sea surface temperatures and hurricane likelihoods and return periods is that tropical cyclones are influenced by many environmental factors beyond just ocean temperatures.

The underlying theory of hurricane intensity was developed by Kerry Emanuel of the Massachusetts Institute of Technology in the 1980s to describe what he called the maximum potential intensity of tropical cyclones.

Emanuel also recognized that “hardly any storms” reach their maximum potential intensity, and fail to:

…maintain intensities near their maximum intensity for any appreciable period, even when potential intensity remains high. This points to flaws in the notion, arising from idealized model studies, that tropical cyclones can maintain nearly steady states and shows that most storms eventually encounter adverse environmental influences, such as vertical wind shear or storm-induced ocean surface cooling, even when they remain over warm ocean water.

Such complexities mean that simple storyline attribution — warmer oceans predictably mean stronger storms — is inappropriate when used to characterize the behavior of individual storms.

But let’s go with the results of the Imperial College conclusions of an annual chance of a Chido-like storm increasing from 7.2% to ~10%.

How many years would it take to detect such a change in observations, using the IPCC threshold for achieving detection (90% confidence)?

According to ChatGPT, as you can see in a coin flip example below, more than 2,100 years.3

Even if storms like Chido were now 2.8% more likely, it would take a very, very long time to detect such a change. Perhaps that is why assumptions are favored over evidence.

Third Trick — Ignoring Evidence

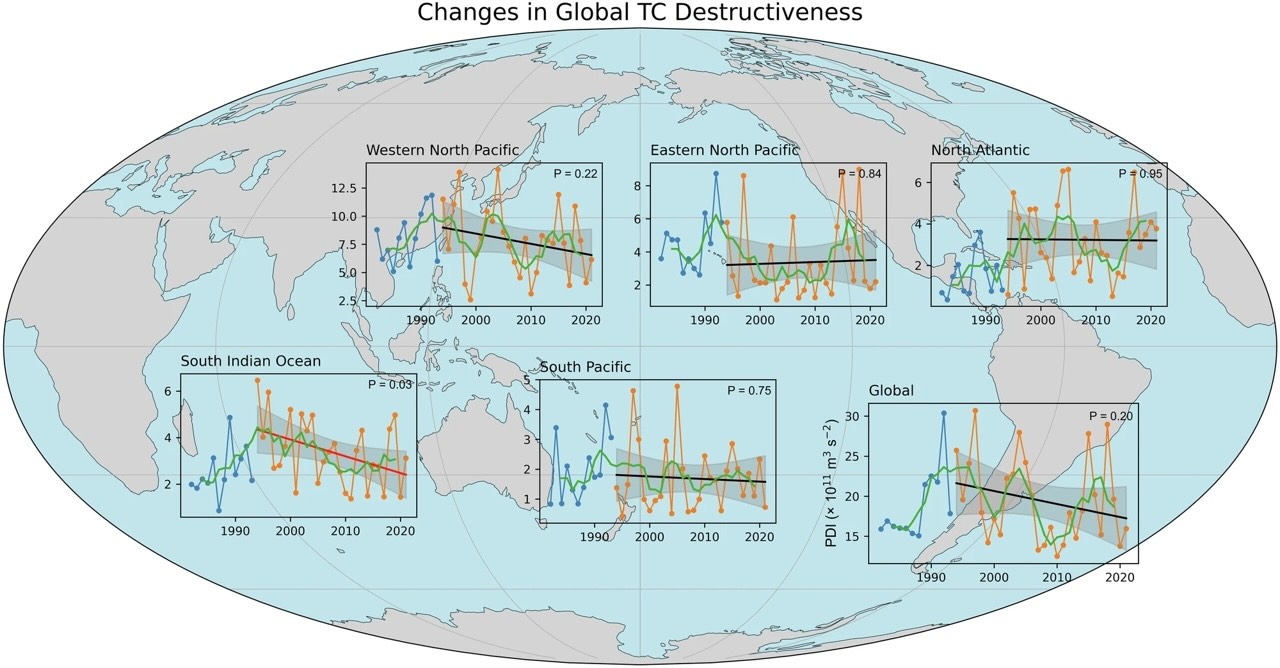
The figure above comes from a recent paper (Tu et al. 2024) titled — Decreasing trend in destructive potential of tropical cyclones in the South Indian Ocean since the mid-1990s.

In fact, as you can see in the figure, in no ocean basin have tropical cyclones seen an increase in their destructive potential over the past 30 years.4

Tu et al. explain (emphasis added):

Here we investigated changes in the destructiveness of tropical cyclones worldwide using the power dissipation index and found that there is no clear trend in most basins, but a significant decrease in power dissipation index has been detected in the South Indian Ocean basin since 1994, which is almost entirely due to a decrease in both tropical cyclone frequency and duration in this basin.

The South Indian Ocean is the basin where Cyclone Chido made landfall earlier this month.


The Honest Broker is written by climate expert Roger Pielke Jr and is reader-supported. If you value what you have read here, please consider subscribing and supporting the work that goes into it.

Read rest at The Honest Broker

  • Truth
  • Twitter
  • Facebook
  • LinkedIn
  • Gettr
  • Threads
  • gab-logo Gab
  • Mastodon
  • Buffer
  • Telegram
  • Email
  • Copy Link
  • Share Using More Networks…
Share via
  • Facebook
  • Like
  • Twitter
  • Pinterest
  • LinkedIn
  • Digg
  • Tumblr
  • VKontakte
  • Print
  • Email
  • Reddit
  • Buffer
  • Love This
  • Weibo
  • Pocket
  • Xing
  • Odnoklassniki
  • WhatsApp
  • Meneame
  • Blogger
  • Amazon
  • Yahoo Mail
  • Gmail
  • AOL
  • Newsvine
  • HackerNews
  • Evernote
  • MySpace
  • Mail.ru
  • Viadeo
  • Line
  • Flipboard
  • Comments
  • SMS
  • Viber
  • Telegram
  • Subscribe
  • Skype
  • Facebook Messenger
  • Kakao
  • LiveJournal
  • Yammer
  • Edgar
  • Fintel
  • Mix
  • Instapaper
  • Copy Link
  • Truth
  • gab-logo Gab
  • Gettr
  • Baidu
  • Mastodon
  • Threads
  • Bluesky

Join our list

Subscribe to our mailing list and get interesting stuff and updates to your email inbox.

Thank you for subscribing.

Something went wrong.

We respect your privacy and take protecting it seriously

Related Posts

Energy

How Wind And Solar Sent Energy Prices Sky-High in ‘Green’ Countries

May 8, 2025
Money & Finance

Bernie Sanders Defends Private Jet Use, Says ‘He’s Too Important’ To Fly Coach

May 8, 2025
Energy

Green Energy Suicide: The West Pays The Price For Its Net-Zero Delusions

May 8, 2025

Comments 8

  1. Fred P says:
    4 months ago

    In the case of Hurricane helene, there were no recorded sustained wind observation of hurricane Force at any land-based station. How would that translate into 100% more likely?

  2. Fred P says:
    4 months ago

    The destructiveness of hurricane Milton that landfall was less than the hurricane of 1848 and the 1921 hurricane in the Tampa Bay area so wondering how climate change enhance those earlier storms?

    • David A says:
      4 months ago

      Beyond the outright lies told by the media…

      Here are six reasons to assert that todays hurricanes are considerably over estimated when compared to past hurricanes, and how those storms were rated.

      1. Dropsondes (Instruments dropped from hurricane hunter airplanes, guided by Doppler to be placed in the most intense part of the storm eye wall) cannot give the one minute sustained wind reading required to determine Hurricane classification, as they stay in a given guest far longer than a fixed instrument…

      …“Turbulence studies have demonstrated that Lagrangian (parcel) wind measurements are inherently smoother than Eulerian (fixed-point anemometer) measurements (Gifford 1955), with dominant periods longer by a factor of about 3–4 (Angell et al. 1971)”.

      1. The “surface” readings have considerable variance, and are often “modeled”. And that is controversial, with considerable debate on how best to do that. Currently the high side of the model is, unsurprisingly, ascendant…

      “Powell and Black (1990) recommended that an adjustment factor of 63%–73% be used to reduce 700-hPa wind speeds to the surface, based on comparisons of flight-level and buoy data (again, mostly outside of the eyewall). Operational practices at the National Hurricane Center (NHC) have varied over time; in recent years surface winds have typically been taken to be 80%–90% of the flight-level wind”

      That is a very large difference where a 100 mph at altitude wind can be considered to be from 62 to 90 mph at the surface. Also individual storm profiles are known to be highly variable, so no one model is right.

      1. Modern hurricane readings predicted storm surge is often considerably over-modeled to actual results. As an example… ” October 4, 1842 – A 955 mbar major hurricane which made landfall on northwestern Florida produced a 20-foot (6 m) storm surge at Cedar Key. Strong winds result in severe damage in Tallahassee.” (This is almost double Helena’s peak 10.5’ storm surge, also at Cedar Key.)
      2. The Safirr Simpdon scale used to categorize hurricane strength for wind damage (excluding storm surge, spin off tornado damage, and rain flood damage), consistently shows observed damage one to two categories below how today’s hurricanes are rated. Past storms do match Saffir Simpson scale damage, as this, beyond the occasional well placed anemometer readings, was the actual method used to classify hurricanes, along with observed storm surge records.
      3. Modern media is very coy with exactly how the category estimates are made, and seldom if ever releases links to the actual flight readings taken right at landfall. Also, by the time the eye wall hits land, close to 50 percent of the storm has already been on land for some time, and the storm is already weakening.
      4. At landfall, especially in a storm like Milton with the eye wall broadening and breaking up, a hurricane hunter aircraft, guided by Doppler radar, will place the dropsconde directly in the strongest part of the storm, and get the highest wind speed possible, fail to confirm sustained wind speed, and get the lowest pressure reading possible. While everything happening on land is considerably less. This makes a huge difference in rating a storm. This site illustrates that message very well. https://www.ventusky.com/

      Go to the site site and watch a time series for Hurricane Milton. Scroll through the time bar for the storm as it approaches land fall. Note how broad the eye becomes, and more importantly, even as the eye wall hits land, the most intense parts of the storm are all offshore on the west side, and southwest side. With the eye evenly split over land and sea, all the strong readings are on Gulf side of the storm, and over the water, and the difference in wind speed to anything over the land is profound.

      On the Vetusky site, set for 10 m surface winds, the highest reading, on the west and southwest ocean sides of the storm is 155 Kph, and over land it is 95 kph. (96 and 59 mph respectively) Now a hurricane aircraft is going to drop the dropsonde right in the strongest part of the storm, not over land, and, as mentioned, that will not give one minute sustained winds. In addition, while a well formed eye tends to have the same barometric pressure throughout the eye, a reforming eye, or a collapsing eye like with Milton, will have variable pressure, and again, guided by doppler, the hurricane hunters will read the lowest pressure part of the storm.

      So we have no idea what past storms would be rated if they had been monitored 24/7 out at sea, and at land fall, and with the same methods used now. For instance, what would this storm have been today? October 11, 1846 – The Great Havana Hurricane of 1846 passed near Key West with an estimated pressure of 902 mbar (hPa) and winds of possibly Category 5 status,[39] damaging or destroying all but 6 of the houses in the city. 50 are killed,[40] and damage amounts to $200,000 (1846 USD, $4.8 million 2008 USD). It is estimated it struck mainland Florida near Cedar Key,[41] producing severe flooding and strong winds.[6]

      Or this one? (note the actual storm surge which matches what was predicted for Tampa when they thought Milton would hit as a Cat 4 or 5 ) … September 25, 1848 – The Great Gale of 1848 strikes near Tampa as a major hurricane with an estimated pressure of 948 mbar.[6] Considered one of the most significant hurricanes in the Tampa area, the 15 foot (4.6 m) storm surge from the hurricane destroyed much of Tampa and nearby Fort Brooke.[42)

      Or the double hitter that struck Florida 17 days later on October 11, 1848 – A major hurricane hits northwestern Florida, causing additional damage to the severe hurricane a few weeks before.[43] ( So media claims of what happened to Florida with Helena and Milton hitting so close being “unprecedented”, is false.)

      So, from 1842 to 1848 Florida was struck by four major hurricanes, often producing much more storm surge and wind damage than Helena or Milton this year. Exactly zero of them were caused by CO2 emissions from people, cars, or cows.https://anderdaa7.substack.com/p/are-modern-hurricanes-rated-to-high

  3. Spurwing Plover says:
    4 months ago

    A researcher to the NYT’s is anymore who blames Hurricanes and Tornados on Climate Change/Global Warming and Trump Voters and Supporters because Trump will cut off their Money

  4. Ed Reid says:
    4 months ago

    Interestingly, none of the attribution organizations have tried to explain why none of Michael Mann’s 33 named storms achieved CAT 6. 😉

  5. alan stewart says:
    4 months ago

    The entire NARRATIVE is based on language/words. As well, taking out of context is systemic by modern Left media. MENACING is defined as something PERCEIVED to be POSSIBLY life threatening. The NYT author and most others are products of a failed education system.

  6. Steve Bunten says:
    4 months ago

    “Activist Scientist” is an oxymoron. If you are an activist then you aren’t practicing science and if you are truly a scientist then you can’t be a activist. But these so-called “activist scientists” have sold their soul for money and fame.

  7. Peter Yarnall says:
    4 months ago

    Once again, a mention of the “pre industrial” baseline.
    The Pre Industrial age was a scientifically acknowledged ice Age (Little Ice Age, 14th-18th Century.)
    Of course things have warmed up since then, what else is expected to happen when an Ice Age ends?
    12 000 years ago, there was a much more disastrous Ice Age, just what caused the planet to warm up after that?

Stay Connected On Social Media

gab-logo

Donate Today

Beating back the alarmist narrative takes time and money. Please donate today to help!

Recent Posts

  • german wind farmHow Wind And Solar Sent Energy Prices Sky-High in ‘Green’ Countries
    May 8, 2025
    Adding more green energy makes power more expensive, not cheaper—due to unreliable output, required fossil fuel backup, and taxpayer subsidies. […]
  • bernie sanders fox newsBernie Sanders Defends Private Jet Use, Says ‘He’s Too Important’ To Fly Coach
    May 8, 2025
    Bernie Sanders and AOC are facing criticism for using private jets while promoting their climate-focused “Fighting Oligarchy” tour. […]
  • blackout stationGreen Energy Suicide: The West Pays The Price For Its Net-Zero Delusions
    May 8, 2025
    Green energy policies clash with reality as Europe and the U.S. face blackouts, soaring costs, and a collapsing power grid. […]
  • wright trump exec orderDOE Scraps $4.5M Website And Logo Project Meant To Showcase Green Agenda
    May 8, 2025
    The DOE canceled a $4.5 million contract the Biden admin awarded for a new agency website and logo that highlighted the green energy transition. […]
  • desantis bill signing‘Dead On Arrival’: DeSantis Signs Law Banning Geoengineering And Weather Modification In Florida
    May 7, 2025
    DeSantis has signed legislation shutting down geoengineering and weather modification projects in Florida amid rising voter concerns. […]
  • columbia protestersNo Worthwhile Research Was Lost In The Columbia Funding Cuts
    May 7, 2025
    Columbia University laid off 180 people after Trump ended grants for leftist equity and global warming research. […]
  • tree ringsHow Activists And Flawed Data Created The Illusion Of A Climate Apocalypse
    May 7, 2025
    Activist-made climate graphic misuses smoothed proxy data to exaggerate modern warming, with IPCC silence fueling ongoing alarmism and misinformation. […]
  • polar bear clappingTwo New Studies Reveal Shocking Polar Ice Gains, Upend Climate Narrative
    May 7, 2025
    Two new studies reveal unexpected polar ice trends, challenging climate assumptions and highlighting the need for pragmatic energy policy. […]
  • offshore wind farmBlue States Sue After Trump Halts ‘Green’ Projects, Seek To Revive Biden’s Wind Subsidies
    May 7, 2025
    Trump halts offshore wind leases, triggering lawsuits from 17 blue states trying to rescue Biden-era green-energy graft from the chopping block. […]
  • chris wright‘Absolute Silliness’: DOE Delays Biden-Era Fossil Fuel Ban In Federal Buildings
    May 6, 2025
    The DOE is postponing a Biden-era rule that would limit fossil fuel use in federal buildings, aligning with Trump's energy priorities. […]

Get Instant Email Notifications

Enter your email address to receive notifications of new posts by email either instantly or daily. Check your Junk folder for any verification emails upon subscribing.

Submit a tip

Please enter your email, so we know you're human.

Books We Like

very convenient warming

exposing great lie

Have a suggestion? Let us know! We swap out books based on your input. We participate in the Amazon Services LLC Associates Program. See here.

  • About
  • Privacy Policy
  • Contact Us

© Portions copyright Climate Change Dispatch

Share via
  • Threads
  • gab-logo Gab
  • Mastodon
  • Buffer
  • Telegram
  • Email
  • Copy Link
  • Share Using More Networks…
No Result
View All Result
  • Home
  • Videos
  • Who We Are
  • Facts Vs. Fearmongering
    • Real science vs Junk Science
      • 1100-plus Peer-Reviewed Studies
      • 97% – Myth of the Climate Change Consensus
      • Michael Crichton: Aliens Cause Global Warming
      • Climate change and its causes
      • Climate Science Primer
      • CO2 is not pollution
      • Deceptive Surface Temperature Records
      • Editorial: Great Global Warming Hoax
      • Rules for Climate Radicals: Part 1
      • Rules for Climate Radicals: Part 2
      • Rules for Climate Radicals: Part 3
      • Why CO2 Is A Minor Player In Global Climate
      • Why Politicized Science Is So Dangerous
    • Facts Not Fear
      • A Simple Question For Climate Alarmists
      • Climate Change – The Facts
      • Climate Change Fears Are Empirically Baseless
      • Global Warming 101
      • Global Warming Q&A
      • Understanding The Medieval Warm Period
      • Ocean Cycles and Climate
      • Overview of Plate Climatology Theory
      • Precautionary Principle
      • Should We Celebrate Carbon Dioxide?
      • The Skeptics Handbook
      • Weather Versus Climate
      • Why I’m a GW skeptic
      • Winning the climate debate with facts
      • Why Aliens Cause Global Warming
    • Greenhouse FAQs
      • CO2, Plants, & Industry
      • How much have temps changed?
      • How much have temps changed?
      • How much have temps changed?
      • Is global warming real?
      • Measuring temperature
      • Swimming in CO2?
      • Scientists urge caution?
      • Today’s warming trend
      • Variations in temperature
    • Gore’s Greatest Goofs
      • Deconstructing the Truth
      • Fact-Checking Al Gore’s Latest Predictions
      • How Gore Created The Global Warming Hoax
    • Inside Real Climate
      • Closer look at the 97% Consensus
      • GW’s Amazing Story
      • IPCC gets failing grade
      • Real Climate Exposed!
      • Truth about Real Climate
      • We’ve Been Conned
      • What is there a 97% consensus about?
    • Behind the IPCC
      • 1,000 Scientists Dissent
      • Climategate: Caught Green-Handed!
      • Climategate Inquiries
      • Climategate Inquiries 2
      • NIPCC Report Now Available
      • Understanding the Climategate Inquiries
  • Submissions
  • Contact Us

© 2025 Climate Change Dispatch