• Privacy Policy
  • About Us
  • Contact Us
Climate Change Dispatch
  • Home
  • Videos
  • Who We Are
  • Facts Vs. Fearmongering
    • Real science vs Junk Science
      • 1100-plus Peer-Reviewed Studies
      • 97% – Myth of the Climate Change Consensus
      • Michael Crichton: Aliens Cause Global Warming
      • Climate change and its causes
      • Climate Science Primer
      • CO2 is not pollution
      • Deceptive Surface Temperature Records
      • Editorial: Great Global Warming Hoax
      • Rules for Climate Radicals: Part 1
      • Rules for Climate Radicals: Part 2
      • Rules for Climate Radicals: Part 3
      • Why CO2 Is A Minor Player In Global Climate
      • Why Politicized Science Is So Dangerous
    • Facts Not Fear
      • A Simple Question For Climate Alarmists
      • Climate Change – The Facts
      • Climate Change Fears Are Empirically Baseless
      • Global Warming 101
      • Global Warming Q&A
      • Understanding The Medieval Warm Period
      • Ocean Cycles and Climate
      • Overview of Plate Climatology Theory
      • Precautionary Principle
      • Should We Celebrate Carbon Dioxide?
      • The Skeptics Handbook
      • Weather Versus Climate
      • Why I’m a GW skeptic
      • Winning the climate debate with facts
      • Why Aliens Cause Global Warming
    • Greenhouse FAQs
      • CO2, Plants, & Industry
      • How much have temps changed?
      • How much have temps changed?
      • How much have temps changed?
      • Is global warming real?
      • Measuring temperature
      • Swimming in CO2?
      • Scientists urge caution?
      • Today’s warming trend
      • Variations in temperature
    • Gore’s Greatest Goofs
      • Deconstructing the Truth
      • Fact-Checking Al Gore’s Latest Predictions
      • How Gore Created The Global Warming Hoax
    • Inside Real Climate
      • Closer look at the 97% Consensus
      • GW’s Amazing Story
      • IPCC gets failing grade
      • Real Climate Exposed!
      • Truth about Real Climate
      • We’ve Been Conned
      • What is there a 97% consensus about?
    • Behind the IPCC
      • 1,000 Scientists Dissent
      • Climategate: Caught Green-Handed!
      • Climategate Inquiries
      • Climategate Inquiries 2
      • NIPCC Report Now Available
      • Understanding the Climategate Inquiries
  • Submissions
  • Contact Us
No Result
View All Result
Climate Change Dispatch
No Result
View All Result

Blowtorch Christmas? Only In Mr. Heat Miser’s Dreams

by Chris Martz, guest post
December 21, 2019, 10:34 AM
in News and Opinion
Reading Time: 5 mins read
A A
5

mister heat miserPosts on social media are notorious for exaggerating claims, and the weather is no exception.

For the last week or so, I’ve been seeing tweet after tweet claiming that Christmas is going to be a “blowtorch” this year across the central and eastern half of the United States.

By “blowtorch,” they mean warm.

There is no doubt in my mind that next week is going to be quite mild relative to average east of the Rocky Mountains given that a ridge of high pressure is currently building in with its center over the Great Lakes (Figure 1).

The polar vortex feature is just northeast of Alaska over the Beaufort Sea where the green contours are. At the same time, a deep trough will be digging down into the North Pacific and the West Coast of North America.

This trough will continue to allow storms to move into the West Coast, dumping lots of snow in the mountains as we progress towards the New Year.

Figure 1. ECMWF 500 millibar height anomaly map for North America; five-day average – WeatherBELL Analytics, L.L.C.

For those of you who are not weather geeks, meteorologists, or aspiring meteorologists like myself, you might be asking yourself: “Why do upper-level ridges result in warm weather?”

If you pay close attention to a TV weather forecast, you’ll likely be familiar with the concept that high pressure at the surface signals clear skies and quiet weather overall.

Depending upon the origin of the air mass, the surface high can either bring in cold air (like we have seen for the past three days across the Midwest and Northeast) or warm air.

The reason why high pressure means clearer skies is because of the sinking motion of air in the atmosphere, which prevents convective cloud development.

Unlike surface highs, ridges of high-pressure feature something that surface highs don’t always have, and that is warm air.

While ridges are good indicators, they don’t always correlate well with warmer than average temperatures at the surface at the local level.

For instance, if a surface low is underneath the ridge, then a localized area may be cooler than average. This can also occur when sea or lake breezes blow cool air onshore over a cold body of water.

As a general rule, areas with overlying ridges can expect mild temperatures during the cool season and hot temperatures during the summer.

Whenever you’re looking at a weather map at the 500 millibar level, ridges are located where the isobars are curving upwards and troughs are located where they dip downwards.

On the map above from WeatherBELL, they make it easier to see where ridges and troughs are for the common person; areas that are orange or red indicate ridges and areas that are blue or purple indicate troughs. Keep in mind that they won’t always be color-coded.

On a weather map, ridges indicate above normal “geopotential heights.” So, what is a geopotential height? Well, simply put, a geopotential height is an altitude at which you’ll find a given pressure level.

Ridges and troughs are easily seen on the 500 millibar map because the altitude at which 500 millibars of air pressure can be found is where half of the atmosphere’s mass is located above and below that altitude.

Remember, Earth’s atmosphere holds 1,000 millibars of air pressure. When all averaged out throughout the Earth’s atmosphere, air pressure decreases exponentially with height due to hydrostatic balance.¹

At an altitude of approximately 18,000 feet (5.5 kilometers), 500 millibars of air pressure can be found. This value (500 millibars, or any pressure level) will change depending upon whether or not there is above average or below average geopotential heights in the atmosphere.

Figure 2. Atmospheric pressure in Earth’s atmosphere – Britannica.

Since warm air expands due to temperature’s direct relationship with volume (Figure 3), V₁/T₁ = V₂/T₂, where V is volume and T is temperature, areas in the atmosphere with such thermal characteristics are identified as having higher heights and are thus ridges.²

Denser air masses are associated with cold air and are commonly associated with upper-level troughs.

Figure 3. Temperature versus volume – Department of Chemistry (FSU).

Judging from recent model guidance, it’s likely that Christmas day will be unseasonably mild on Christmas day east of the Rockies, but south of the Midwest (Figure 4).

Highs along the Rio Grande, across the Deep South and down into Florida will be well into the 70s, maybe approaching 80°F (26.7°C) south of Orlando, Florida.

From Northern Texas east to North Carolina, highs will easily top off in the 60s.

There will be a sharp temperature gradient however stretching across the Plains, Midwest, and Mid-Atlantic dividing polar and tropical air masses.

Figure 4. NWS forecast high temperatures on Christmas day – WeatherBELL Analytics L.L.C.

The warm sector of the country on Christmas day is being portrayed by some people as an outright blowtorch. Of course, temperatures at that time will be above average on the order of 10°F (5.6°C), give or take a few degrees (Figure 5).

Figure 5. ECMWF 2 meter temperature anomalies for the U.S. on December 24 and 25 – WeatherBELL Analytics, L.L.C.

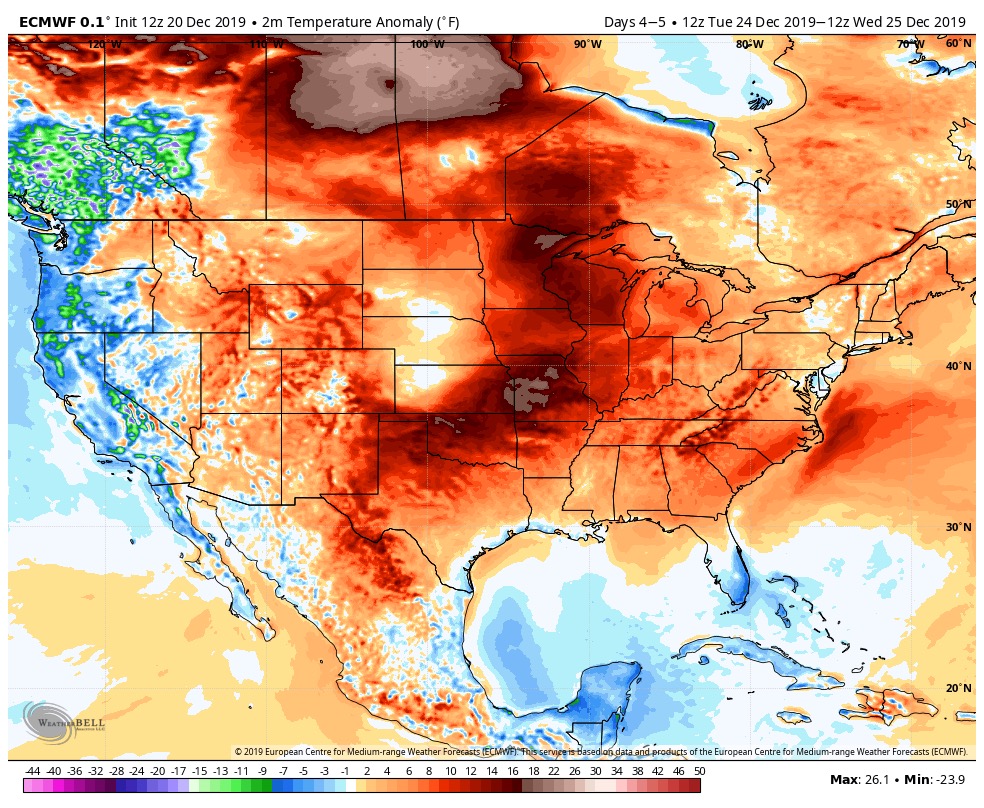
Given that climate activists tend to find the color orange appealing on temperature maps, I’m having a hunch that they’ll be having a field day with the upcoming weather next week.

I’m sure all kinds of wonderful articles will pop up claiming that we’re having “Hottest Christmas Ever” only to find out that this will not be the case.

Four years ago, as many of you may recall, the eastern United States had quite a warm Christmas. Over 44% of the Lower 48 was above 50°F (10°C), over 33% was above 60°F (15.6°C), and exactly 20% was over 70°F (21.1°C) (Figure 6).

Temperatures across the southern tip of Texas and Florida were around 90°F (32.2°C), while 80°F (26.7°C) readings were recorded as far north as southeastern Virginia. Temperatures over 70°F (21.1°C) were reported well into New England.

Figure 6. PRISM 4 km daily high temperature across the United States on December 25, 2015 – WeatherBELL Analytics L.L.C.

Temperatures were some 15 to 30°F (8.3 to 16.7°C) above average from Texas to Maine (Figure 7).

Figure 7. PRISM 4 km daily high-temperature anomalies across the United States on December 25, 2015 – WeatherBELL Analytics L.L.C.

However, despite this, 2015 was not the warmest Christmas Day in the United States. That would be 1922 and 1955, where the average high temperature among all USHCN stations was around 54°F (12.2°C).³

In 1955, temperatures as high as 80°F (26.7°C) were recorded as far north as Farmville, Virginia, and most stations across the Deep South and the Southeastern United States were above 80°F (26.7°C), which were a bit higher than they were in 2015.

Temperatures as hot as 90°F (32.2°C) were recorded in southern Texas.

Figure 8. Temperatures at all USHCN stations on December 25, 1955 – Real Climate Science.

Temperatures in the 60s or higher occurred over a wide area stretching from Washington state (one location, Walla Walla) throughout the Southwest, Southern Plains, Southern Midwest, Southeast, and Mid-Atlantic (Figure 9).⁴

Figure 9. Stations at or above 60°F on Christmas day in 1955 – Real Climate Science.

Since 1917, average maximum temperatures on Christmas day at all USHCN stations have been on a statistically insignificant decline (Figure 10).³

Figure 10. December 25 average maximum temperature from 1917 to 2017 at all USHCN stations – Real Climate Science.

Given these facts, I see no reason for anybody to be concerned about Christmas temperatures. Anyone who attempts to attribute human-induced climate change on next week’s expected “mild” temperatures will be skating on thin ice.

In other words, Christmas hasn’t lost its seasonal chill, so don’t be Mr. Heat Miser and lose yours. 😉

REFERENCES

[1] Augustyn, Adam. “Atmospheric Pressure.” Encyclopedia Britannica. Encyclopedia Britannica, inc., February 13, 2019. Accessed December 20, 2019. https://www.britannica.com/science/atmospheric-pressure.

[2] “Gas Laws.” Department of Chemistry [FSU]. Florida State University. Accessed December 20, 2019. https://www.chem.fsu.edu/chemlab/chm1045/gas_laws.html.

[3] Heller, Tony. “Declining Christmas Temperatures In The US.” Real Climate Science, December 17, 2017. Accessed December 20, 2019. https://realclimatescience.com/2017/12/declining-christmas-temperatures-in-the-us/.

[4] Heller, Tony. “Christmas Day, 1955” Real Climate Science, December 25, 2015. Accessed December 20, 2019. https://realclimatescience.com/2015/12/christmas-day-1955/.

Chris Martz is a soon-to-be meteorologist and runs the website Awesome Weather Facts and Chris Martz Weather. He regularly writes about the climate, our weather, and forecasting.

  • Truth
  • Twitter
  • Facebook
  • LinkedIn
  • Gettr
  • Threads
  • gab-logo Gab
  • Mastodon
  • Buffer
  • Telegram
  • Email
  • Copy Link
  • Share Using More Networks…

Popular Posts

Electric Vehicles (EVs)

The ‘Green’ Scam Of The Century: How ‘Renewables’ Increase Fossil Fuel Demands

Oct 23, 2024
News and Opinion

Antarctica Is Colder, Icier Today Than At Any Time In 5,000 Years

Apr 15, 2024
Energy

30-Plus Signs That The Climate Scam Is Collapsing

Apr 09, 2025

Comments 5

  1. Spurwing Plover says:
    6 years ago

    All Global Warming,Climate Change,Fragile Earth,Delicate Balance of Nature,DDT,CFC’s all this 12 years left its a whole load of Malarkey It looks like Enviromentalisms becoming new pagan religion in America with Greta Thunburg as their High Prestess

  2. Brian James says:
    6 years ago

    “What we call Man’s power over Nature turns out to be a power exercised by some men over other men with Nature as its instrument.” C. S. Lewis

  3. pater eusebius tenebrarum says:
    6 years ago

    I for one am glad the weather has been fairly mild so far in the current cold season. I wish it would be like that every year…

  4. David Lewis says:
    6 years ago

    Climate alarmists are so desperate to justify their agenda they will assume anything out of the ordinary is from climate change.

    Returning from one Christmas trip we knew coming in was a one way trip because the snow was so deep that our Suburban with four wheel drive and four studded snow tires wouldn’t be able to climb the steep hill. The main gate couldn’t be opened because of the deep snow; fortunately a side gate had been left open. Another Christmas the creek that supplies our water froze. Bring on the blow torch!

  5. Spurwing Plover says:
    6 years ago

    The trouble is their lying to the kids in school which is nothing new many science text books still display those fake embreyos long since proven to be fakes as real when their not

Stay Connected On Social Media

gab-logo

Donate Today

Beating back the alarmist narrative takes time and money. Please donate today to help!

Recent Posts

  • Newsom interviewNewsom’s Man-Made Energy Crisis Drags California Toward Disaster
    Nov 26, 2025
    California’s man-made energy crisis has only intensified as Newsom’s policies drove up costs, forced out suppliers, and undercut military readiness. […]
  • COP30 opening ceremonyClimate Apocalypse Crumbles: COP30 Flops, Activists Collapse, Fossil Fuels Thrive
    Nov 26, 2025
    COP30 flops, climate activist groups collapse, and fossil fuel demand keeps rising—more signs the climate apocalypse narrative is unraveling. […]
  • oyster fishingFishing Fears: Al Jazeera Casts Climate Alarm Over Fiji’s Thriving Oyster Catch
    Nov 26, 2025
    Fiji’s oyster industry thrives despite Al Jazeera’s climate scare claims, proving growth continues amid exaggerated warnings. […]
  • Venice Grand Canal green dyeGreta Thunberg Gets Two-Day Ban After Dumping Green Dye Into Venice’s Grand Canal
    Nov 25, 2025
    Thunberg and Extinction Rebellion staged weekend stunts across Venice, drawing fines, bans, and local ire while targeting COP30 climate inaction. […]
  • hurricane from spaceNOAA’s 2025 Hurricane Forecast Misses The Mark As U.S. Escapes Storms
    Nov 25, 2025
    Despite warnings of an above-normal season, only 13 named storms formed and no hurricanes hit the U.S. […]
  • hurricane stormShocker: 2025 Hurricane Predictions Flop; No U.S. Landfalls For First Time in 10 Years
    Nov 25, 2025
    Media-predicted 2025 hurricane disaster never hit the U.S., marking the first landfall-free season in a decade. […]
  • cop30 montageCOP30 Descends Into Chaos Amid Deforestation And China’s Climate Power Play
    Nov 25, 2025
    COP30 spiraled into chaos as Amazon clearing, venue failures, and China’s big climate push overshadowed the UN’s so-called summit. […]
  • gavel earth courtSupreme Court To Weigh In On ‘Climate Lawfare’ Jurisdiction Fight
    Nov 24, 2025
    Supreme Court steps into a growing clash as activists push state courts and energy companies fight for federal review in sweeping climate lawsuits. […]
  • oil gas rigFossil Fuel Demand Climbs As Green Transition Stalls
    Nov 24, 2025
    Fossil fuel demand keeps climbing as climate targets and green energy promises clash with global power needs. […]
  • npr tipping points fantasyNPR’s Climate Alarmism Gets A Reality Check: Three ‘Massive’ Claims, Zero Evidence
    Nov 24, 2025
    NPR falsely warns that Greenland ice, coral reefs, and permafrost face climate 'tipping points'; these claims are activism disguised as reporting. […]

Get Instant Email Notifications

Subscribe to receive a digest of daily stories, or get emailed once they're published. Check your Junk/Spam folder for a verification email.

Submit a tip

Please enter your email, so we know you're human.

Books You May Like

exposing great lie

Have a suggestion? Let us know! We swap out books based on your input. We participate in the Amazon Services LLC Associates Program. See here.

  • About
  • Privacy Policy
  • Contact Us

© Portions copyright Climate Change Dispatch

No Result
View All Result
  • Home
  • Videos
  • Who We Are
  • Facts Vs. Fearmongering
    • Real science vs Junk Science
      • 1100-plus Peer-Reviewed Studies
      • 97% – Myth of the Climate Change Consensus
      • Michael Crichton: Aliens Cause Global Warming
      • Climate change and its causes
      • Climate Science Primer
      • CO2 is not pollution
      • Deceptive Surface Temperature Records
      • Editorial: Great Global Warming Hoax
      • Rules for Climate Radicals: Part 1
      • Rules for Climate Radicals: Part 2
      • Rules for Climate Radicals: Part 3
      • Why CO2 Is A Minor Player In Global Climate
      • Why Politicized Science Is So Dangerous
    • Facts Not Fear
      • A Simple Question For Climate Alarmists
      • Climate Change – The Facts
      • Climate Change Fears Are Empirically Baseless
      • Global Warming 101
      • Global Warming Q&A
      • Understanding The Medieval Warm Period
      • Ocean Cycles and Climate
      • Overview of Plate Climatology Theory
      • Precautionary Principle
      • Should We Celebrate Carbon Dioxide?
      • The Skeptics Handbook
      • Weather Versus Climate
      • Why I’m a GW skeptic
      • Winning the climate debate with facts
      • Why Aliens Cause Global Warming
    • Greenhouse FAQs
      • CO2, Plants, & Industry
      • How much have temps changed?
      • How much have temps changed?
      • How much have temps changed?
      • Is global warming real?
      • Measuring temperature
      • Swimming in CO2?
      • Scientists urge caution?
      • Today’s warming trend
      • Variations in temperature
    • Gore’s Greatest Goofs
      • Deconstructing the Truth
      • Fact-Checking Al Gore’s Latest Predictions
      • How Gore Created The Global Warming Hoax
    • Inside Real Climate
      • Closer look at the 97% Consensus
      • GW’s Amazing Story
      • IPCC gets failing grade
      • Real Climate Exposed!
      • Truth about Real Climate
      • We’ve Been Conned
      • What is there a 97% consensus about?
    • Behind the IPCC
      • 1,000 Scientists Dissent
      • Climategate: Caught Green-Handed!
      • Climategate Inquiries
      • Climategate Inquiries 2
      • NIPCC Report Now Available
      • Understanding the Climategate Inquiries
  • Submissions
  • Contact Us

© 2025 Climate Change Dispatch

 
Share via
  • Facebook
  • Like
  • Twitter
  • Pinterest
  • LinkedIn
  • Digg
  • Tumblr
  • VKontakte
  • Print
  • Email
  • Reddit
  • Buffer
  • Love This
  • Weibo
  • Pocket
  • Xing
  • Odnoklassniki
  • WhatsApp
  • Meneame
  • Blogger
  • Amazon
  • Yahoo Mail
  • Gmail
  • AOL
  • Newsvine
  • HackerNews
  • Evernote
  • MySpace
  • Mail.ru
  • Viadeo
  • Line
  • Flipboard
  • Comments
  • SMS
  • Viber
  • Telegram
  • Subscribe
  • Facebook Messenger
  • Kakao
  • LiveJournal
  • Yammer
  • Edgar
  • Fintel
  • Mix
  • Instapaper
  • Copy Link
  • Truth
  • gab-logo Gab
  • Gettr
  • Baidu
  • Mastodon
  • Threads
  • Bluesky
Share via
  • Digg
  • Tumblr
  • VKontakte
  • Print
  • Email
  • Reddit
  • Buffer
  • Love This
  • Weibo
  • Pocket
  • Xing
  • Odnoklassniki
  • WhatsApp
  • Meneame
  • Blogger
  • Amazon
  • Yahoo Mail
  • Gmail
  • AOL
  • Newsvine
  • HackerNews
  • Evernote
  • MySpace
  • Mail.ru
  • Viadeo
  • Line
  • Flipboard
  • Comments
  • SMS
  • Viber
  • Telegram
  • Subscribe
  • Facebook Messenger
  • Kakao
  • LiveJournal
  • Yammer
  • Edgar
  • Fintel
  • Mix
  • Instapaper
  • Copy Link
  • Truth
  • gab-logo Gab
  • Gettr
  • Baidu
  • Mastodon
  • Threads
  • Bluesky