Smoking Gun #6: Antarctica isn’t warming
If there is any place on earth that is a natural control for the impact of increasing atmospheric CO2 it is Antarctica. Antarctica’s average winter temperature is -60 degrees Celsius which is close to the peak absorption of CO2 of -80 degrees Celsius.
Most importantly however is that the Antarctica air is very very very dry, so there is no impact from water vapor. The only significant GHG in the South Pole Troposphere is CO2.
Talking Points:
- Satellite measurements show no South Pole warming over the past 36 years. During this time CO2 increased from 330 ppm to 404 ppm.
- Ground measurements show no South Pole warming over the past 59 years. During that time CO2 increased from 315 ppm to 405 ppm.
- Increasing CO2 nearly 30% had no impact on temperatures in the region most likely to be impacted by an increase if CO2.
- The North Pole is not a “control” for CO2 because its temperature is largely influenced by ocean currents. BTW, an ice-free North Pole is nothing new or anything to be alarmed about. The graphic is of the USS Skate SSN-578.
- What efforts to prove Antarctica has been warming with the rest of the globe have failed.
Smoking Gun #7: Antarctica isn’t warming, but the Oceans are warming
Once again, when discussing CO2-caused climate change or global warming, the question that needs to be asked is how does CO2 cause the observation. CO2’s only defined mechanism by which to affect climate change is to absorb IR radiation between the wavelengths of 13 and 18 microns, that is it. CO2 can only cause warming by “trapping” outgoing radiation.
Talking Points:
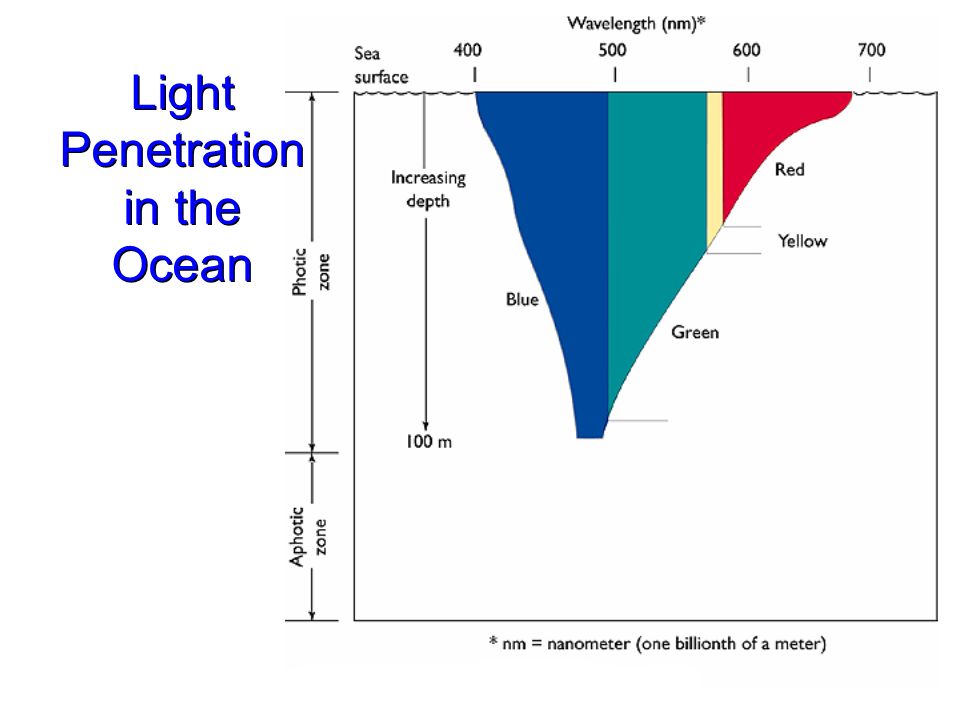
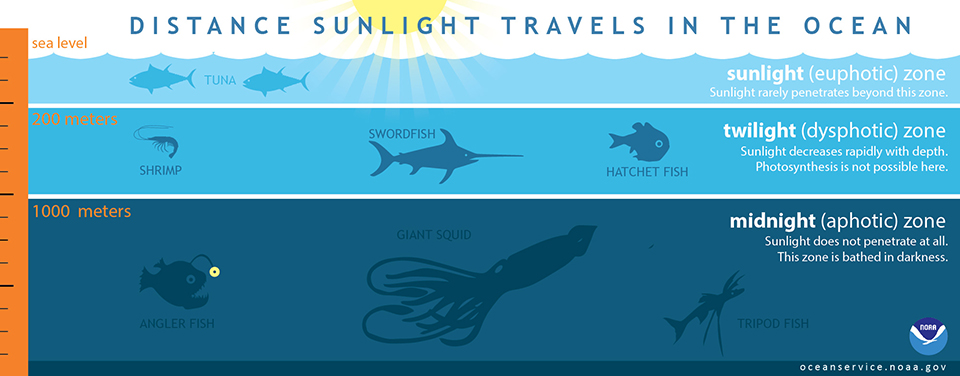
- Only incoming visible and ultraviolet light penetrates and warms the oceans. IR radiation does not penetrate the oceans, has very little energy and most likely results in cooling the oceans through surface evaporation.
- The oceans hold over 1,000x more energy than the atmosphere. There simply isn’t enough energy in the entire atmosphere to warm the oceans. The oceans are warmed by incoming radiation and geothermal sources.
- Warming oceans also outgas CO2 into the atmosphere. That is why CO2 lags temperature. It takes time to warm the oceans, and as the oceans warm they release CO2. That is also why CO2 falls during ice ages. Cold water absorbs more CO2. This is due to Henry’s law and can be observed by warming a glass of Coke.
- The fact that the oceans are warming is evidence of more incoming high energy visible radiation reaching the earth’s surface, not evidence of CO2 trapping outgoing low energy IR.
- Climate models almost exclusively focus on CO2 levels and ignore incoming high energy visible radiation and atmospheric H20 levels which likely explains why they are so inaccurate.
- What is warming the oceans is also most likely what is warming the atmosphere.
- Either there are two distinct phenomena occurring, one caused by man and one caused by nature, or there is only one natural phenomenon causing both (which has been the case throughout all of history). Either something natural is warming the oceans and man’s CO2 is warming the atmosphere, or the same natural cause is warming both the oceans and the atmosphere above it.
Smoking Gun #8: Atmospheric Temperatures follow ocean temperatures, not atmospheric CO2.
Talking Points:
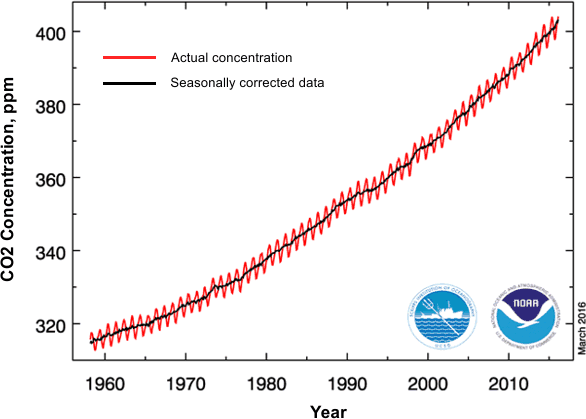
- The increase in atmospheric CO2 is near-linear, atmospheric temperatures are not.
- Atmospheric CO2 and Atmospheric Temperatures simply aren’t correlated, and there certainly isn’t the linear relationship that exists in the IPCC Models.
- In reality, atmospheric temperatures follow the ocean temperatures, not atmospheric CO2. Ocean temperatures are dependent upon the amount of incoming solar radiation that reaches them combined with ocean cycles such as the Pacific Decadal Oscillation (PDO/El Nino/El Nina) and others. The balance of incoming and outgoing radiation is why the atmospheric temperature forms spikes and steps instead of a smooth linear increase.
Smoking Gun #9: Atmospheric CO2 follows ocean temperatures, not man’s combustion.
Talking Points:
- Man’s rate of CO2 creation is increasing, yet the rate of change in atmospheric CO2 is highly variable.
- The rate of change in atmospheric CO2 is highly correlated with atmospheric temperatures, which are highly correlated with ocean temperatures and cycles.
- Man’s production of CO2 can not explain the large variation in either the atmospheric CO2 or atmospheric temperatures. Ocean temperatures can explain both.
- There is no mechanism by which CO2 would allow global temperatures to cool, CO2 only increases, and it only absorbs more and more energy. CO2 can’t explain the large rapid coolings which frequently occur.
Smoking Gun #10: Record High Day Time Temperatures is NOT evidence of AGW
Once again, when discussing AGW, you always have to tie the observation back to CO2 and its lone mechanism to affect climate change by absorbing long-wave IR between 13 and 18 microns.
CO2 traps outgoing radiation from an already warmed earth, CO2 and IR don’t warm the earth. CO2 is transparent to incoming warming visible and UV radiation.
Talking Points:
- Daytime temperatures are determined by the amount of incoming radiation that reaches the earth’s surface and have nothing to do with atmospheric CO2.
- CO2 traps outgoing radiation, record high temperatures require new energy to be added to the system. CO2 does not add energy to the system.
- During a hot summer day you can fry an egg on the hood of a car, but that has nothing to do with AGW or CO2 and everything to do with incoming radiation.
- If AGW and CO2 was the true cause of the warming, you would be able to fry an egg on a hot day in the shade of a tree using only the back radiation from the atmosphere.
- True evidence of AGW and CO2 caused warming would be that the spread between day and night temperatures would be narrowing in the very dry deserts. I’ve found no evidence of that happening, in fact, the South Pole proves otherwise.
- Water vapor dominates the heat-trapping in the lower atmosphere and is why you can sleep naked in a rain forest, but not in a dry desert.
- The fact that record daytime temperatures are being set is evidence that more energy is being added to the system. That alone can explain the warming, and CO2 has nothing to do with it.
Smoking Gun #11: The Scientific Method is Ignored, The Null is not Rejected
Classical science is done through the “Scientific Method.” An observation is made, a hypothesis is formed, experiments are designed, data is collected, the data is analyzed and the hypothesis is either accepted or rejected.
In most fields of science, the “null hypothesis” is the status quo or the accepted explanation. If in that rare case the null hypothesis is in fact rejected, the research is published and others will rush to “replicate” the experiments to validate the findings.
True science is based upon skepticism and the “belief in the ignorance of experts.” Science progresses through falsification, over-turning the apple cart, proving the experts wrong, angering one’s “peers” and defying the “consensus.”
Classical science is not done by following the bandwagon, agreeing with the consensus and being welcomed, accepted and celebrated by like-minded “peers.” Real science is done by proclaiming that “the earth is not flat dammit, and I’m going to prove it, and I don’t care what anyone else thinks.”
How then would the scientific method be applied to the field of climate science? An observation is made that both temperatures and CO2 have been increasing since the dawn of the industrial age.
A hypothesis is made that man-made CO2 must be causing the increase in temperatures, the commonly accepted/status quo belief is that climate change is natural.
Experiments would be designed and data would be collected and then analyzed. For this smoking gun we will ignore the design experiments part because the field of climate science doesn’t rely on experiments, it is almost completely dependent upon data samples and computer models.
I’ll address some experiments in a later smoking gun, this smoking gun will focus on the ice core data to determine if the temperature variation during the period when mankind has been producing CO2 (the past 150 and 50 years) is statistically different from the previous 12,000 years of the Holocene.
Talking Points:
- Using the scientific method and applying it to the available ice core data, the null hypothesis that climate change is natural IS NOT REJECTED.
- The relevant data is the temperature and CO2 data for the “Holocene.” Download any ice core data set and test the hypothesis yourself. I have yet to find a single ice core data set that shows the temperature variation over the past 150 and/or 50 years is statistically different from the previous 12 to 15,000 years of the Holocene. Note, you have to use surface temperatures for the most recent 50 years.
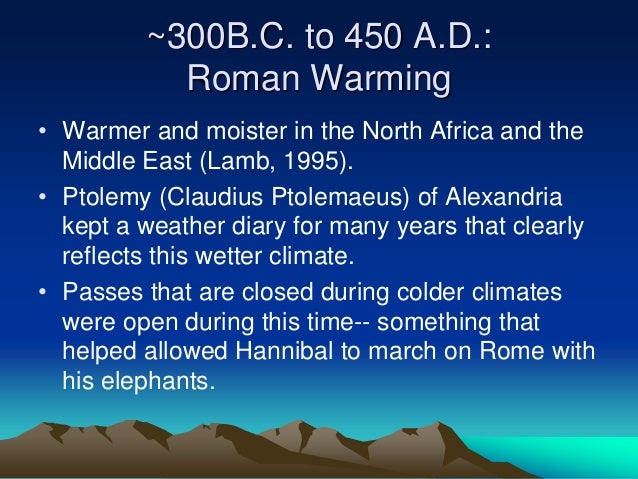
- There have been many previous temperature peaks during the Holocene, all of which reached temperatures above today’s level. The Minoan, Roman and Medieval warming periods were all warmer than today. Archaeological evidence of a warmer past are Roman vineyards in Northern England and the Vikings inhabited and farmed Greenland.
- I have yet to find a single ice core data set demonstrating that current temperatures are at a peak for the Holocene. It is important to note that when NASA/NOAA, the Main Stream Media or Al Gore report that “we are experiencing the hottest year on record,” they are referring only to the past 156 years of instrumental records, not the ice core data or the entire Holocene. Those data set begin right when an unusually cold period called the “Little Ice Age” was ending. Much of the warming since 1860 is nothing more than the earth rebounding from an unusually cold period.
Smoking Gun #12: Doubling CO2 has NO MEASURABLE IMPACT on the lower atmosphere temperature, none
The main data sources used to support the AGW Theory are ground-level surface and ocean thermometers. There are all sorts of problems with this approach such as the “Urban Heat Island Effect,” and the non-transparent process of “adjustments.” Those issues aside, once again, the warming has to be tied to CO2 and trapping outgoing radiation between 13 and 18 microns. Fortunately, NASA has a program to define and answer many climate-related questions. MODTRAN is a wonderful tool to use when discussing global warming with a climate alarmist, it will save you countless headaches.
Talking Points:
- Looking down from 1 km (the atmospheric layer where all thermometers are located) the Upward IR Flux when CO2 if 400 ppm is 407.572 W/M^2.
- Ceteris paribus, doubling CO2 to 800 ppm results in an Upward IR Flux of 407.572 W/M^2.
- According to MODTRAN, doubling CO2 has no measurable impact on the energy balance is the lower 1 km of the atmosphere that contains all the ground/surface/ocean temperature measurements. The net change to the energy balance is 0.000 W/M^2.
- Simply cutting the humidity in half changes the UpWard IR Flux to 409.456 W/M^2.
- Adding a simple stratus cloud base will change it to 396.896 W/M^2, in other words, when clouds and water vapor are considered, CO2 becomes irrelevant.
- For the entire atmosphere (looking down from 70 km), changing CO2 from pre-industrial 280 ppm to the current 400 ppm changed the Upward IR Flux from 282.600 to 280.999 W/M^2, or less than 2 W/M^2 throughout the entire atmosphere. A simple cloud layer alters the balance by over 10 W/M^2.
Smoking Gun #13: The ground measurement data supporting the AGW Theory is very suspect
Talking Points:
- Ground measurements are continually subject to opaque “adjustments.”
- Ground measurements do not correlate well with Satellite and Balloon measurements.
- Satellite data shows no significant warming since 1997, and much of the warming is clearly due to El Nino caused temperature spikes.
- CO2 has substantially increased during this period that is referred to as “the pause.”
- The data adjustments aren’t similar to adjustments for random errors, where the adjustments are also random in nature. Temperature “adjustments” almost universally increase the slope of the temperature graph, lowering distal and elevating proximal data. The result is to suspiciously make the temperature increase more linear and in line with the CO2 increase. This issue will be addressed in a later smoking gun.